时间序列预测之 AUTO-ARIMA
作者:互联网
参考链接:常用7种时间序列预测模型
运用ARIMA进行时间序列建模的基本步骤:
- 1)加载数据:构建模型的第一步当然是加载数据集。
- 2)预处理:根据数据集定义预处理步骤。包括创建时间戳、日期/时间列转换为d类型、序列单变量化等。
- 3)序列平稳化:为了满足假设,应确保序列平稳。这包括检查序列的平稳性和执行所需的转换。
- 4)确定d值:为了使序列平稳,执行差分操作的次数将确定为d值。
- 5)创建ACF和PACF图:这是ARIMA实现中最重要的一步。用ACF PACF图来确定ARIMA模型的输入参数。
- 6)确定p值和q值:从上一步的ACF和PACF图中读取p和q的值。
- 7)拟合ARIMA模型:利用我们从前面步骤中计算出来的数据和参数值,拟合ARIMA模型。
- 8)在验证集上进行预测:预测未来的值。
- 9)计算RMSE:通过检查RMSE值来检查模型的性能,用验证集上的预测值和实际值检查RMSE值。
ARMA模型公式:

信息准则定阶
- AIC(Akaike Information Criterion)
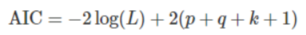
L是数据的似然函数,k=1表示模型考虑常数c,k=0表示不考虑。最后一个1表示算上误差项,所以其实第二项就是2乘以参数个数。
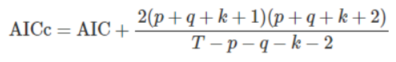
- AICc(修正过的AIC)
- BIC(Bayesian Information Criterion)

注意事项:
- 信息准则越小,说明参数的选择越好,一般使用AICc或者BIC。
- 差分d,不要使用信息准则来判断,因为差分会改变了似然函数使用的数据,使得信息准则的比较失去意义,所以通常用别的方法先选择出合适的d。
- 信息准则的好处是可以在用模型给出预测之前,就对模型的超参做一个量化评估,这对批量预测的场景尤其有用,因为批量预测往往需要在程序执行过程中自动定阶。
模型构建
from statsmodels.tsa.arima_model import ARIMA

# 1,1,2 ARIMA Model
model = ARIMA(df.value, order=(1,1,2))
model_fit = model.fit(disp=0)
print(model_fit.summary())


中间的表格列出了训练得到的模型各项和对应的系数,如果系数很小,且‘P>|z|’ 列下的P-Value值远大于0.05,则该项应该去掉,比如左图中的ma部分的第二项,系数是-0.0010,P-Value值是0.998,那么可以重建模型为ARIMA(1,1,1),从右图可以看到,修改阶数后的模型的AIC等信息准则都有所降低:
通常会检查模型拟合的残差序列,即训练数据原本的序列减去训练数据上的拟合序列后的序列。该序列越符合随机误差分布(均值为0的正态分布),说明模型拟合的越好,否则,说明还有一些因素模型未能考虑。
# Plot residual errors
residuals = pd.DataFrame(model_fit.resid)
fig, ax = plt.subplots(1,2)
residuals.plot(title="Residuals", ax=ax[0])
residuals.plot(kind='kde', title='Density', ax=ax[1])
plt.show()

# Actual vs Fitted
model_fit.plot_predict(dynamic=False)
plt.show()


from statsmodels.tsa.stattools import acf

# Create Training and Test
train = df.value[:85]
test = df.value[85:]

# Build Model
model = ARIMA(train, order=(3,2,1))
# model = ARIMA(train, order=(1, 1, 1))    #预测效果很差,选用上面的效果有提升
fitted = model.fit(disp=-1)

# Forecast
fc, se, conf = fitted.forecast(15, alpha=0.05)  # 95% conf

# Make as pandas series
fc_series = pd.Series(fc, index=test.index)
lower_series = pd.Series(conf[:, 0], index=test.index)
upper_series = pd.Series(conf[:, 1], index=test.index)

# Plot
plt.figure(figsize=(12,5), dpi=100)
plt.plot(train, label='training')
plt.plot(test, label='actual')
plt.plot(fc_series, label='forecast')
plt.fill_between(lower_series.index, lower_series, upper_series,
                 color='k', alpha=.15)
plt.title('Forecast vs Actuals')
plt.legend(loc='upper left', fontsize=8)
plt.show()

AUTO-ARIMA模型 (python - pmdarima;r - forecast)
通过预测结果来推断模型阶数的好坏毕竟还是耗时耗力了些,一般可以通过计算AIC或BIC的方式来找出更好的阶数组合。pmdarima模块的auto_arima方法就可以让我们指定一个阶数上限和信息准则计算方法,从而找到信息准则最小的阶数组合。
from statsmodels.tsa.arima_model import ARIMA
import pmdarima as pm

df = pd.read_csv('https://raw.githubusercontent.com/selva86/datasets/master/wwwusage.csv', names=['value'], header=0)

model = pm.auto_arima(df.value, start_p=1, start_q=1,
                      information_criterion='aic',
                      test='adf',       # use adftest to find optimal 'd'
                      max_p=3, max_q=3, # maximum p and q
                      m=1,              # frequency of series
                      d=None,           # let model determine 'd'
                      seasonal=False,   # No Seasonality
                      start_P=0,
                      D=0,
                      trace=True,
                      error_action='ignore',
                      suppress_warnings=True,
                      stepwise=True)

print(model.summary())

# Forecast
n_periods = 24
fc, confint = model.predict(n_periods=n_periods, return_conf_int=True)
index_of_fc = np.arange(len(df.value), len(df.value)+n_periods)

# make series for plotting purpose
fc_series = pd.Series(fc, index=index_of_fc)
lower_series = pd.Series(confint[:, 0], index=index_of_fc)
upper_series = pd.Series(confint[:, 1], index=index_of_fc)

# Plot
plt.plot(df.value)
plt.plot(fc_series, color='darkgreen')
plt.fill_between(lower_series.index,
                 lower_series,
                 upper_series,
                 color='k', alpha=.15)

plt.title("Final Forecast of WWW Usage")
plt.show()

如何自动构建季节性ARIMA模型?
如果模型带有季节性,则除了p,d,q以外,模型还需要引入季节性部分: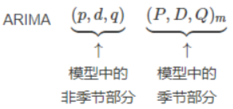
与非季节性模型的区别在于,季节性模型都是以m为固定周期来做计算的,比如D就是季节性差分,是用当前值减去上一个季节周期的值,P和Q和非季节性的p,q的区别也是在于前者是以季节窗口为单位,而后者是连续时间的。
上节介绍的auto arima的代码中,seasonal参数设为了false,构建季节性模型的时候,把该参数置为True,然后对应的P,D,Q,m参数即可,代码如下:
# !pip3 install pyramid-arima
import pmdarima as pm
# Seasonal - fit stepwise auto-ARIMA
smodel = pm.auto_arima(data, start_p=1, start_q=1,
                         test='adf',
                         max_p=3, max_q=3, m=12,
                         start_P=0, seasonal=True,
                         d=None, D=1, trace=True,
                         error_action='ignore',
                         suppress_warnings=True,
                         stepwise=True)
smodel.summary()
注意这里的stepwise参数,默认值就是True,表示用stepwise algorithm来选择最佳的参数组合,会比计算所有的参数组合要快很多,而且几乎不会过拟合,当然也有可能忽略了最优的组合参数。所以如果你想让模型自动计算所有的参数组合,然后选择最优的,可以将stepwise设为False。
如何在预测中引入其它相关的变量?
标签:index,plt,AUTO,模型,ARIMA,series,序列,model 来源: https://www.cnblogs.com/iupoint/p/14621830.html