EKS 训练营-容器监控(15)
作者:互联网
# 介绍
[Prometheus](https://prometheus.io/) is an open-source systems monitoring and alerting toolkit originally built at SoundCloud. Since its inception in 2012, many companies and organizations have adopted Prometheus, and the project has a very active developer and user community. It is now a standalone open source project and maintained independently of any company. Prometheus joined the Cloud Native Computing Foundation in 2016 as the second hosted project, after Kubernetes.
[Grafana](https://grafana.com/) is open source visualization and analytics software. It allows you to query, visualize, alert on, and explore your metrics no matter where they are stored. In plain English, it provides you with tools to turn your time-series database (TSDB) data into beautiful graphs and visualizations.
# 部署 Prometheus
我们使用 helm 来安装,首先安装 promethus 的仓库。
```bash
helm repo add prometheus-community https://prometheus-community.github.io/helm-charts
```
创建 Prometheus 命名空间。
```bash
kubectl create namespace prometheus
```
部署 Prometheus。
```bash
helm install prometheus prometheus-community/prometheus \
--namespace prometheus \
--set alertmanager.persistentVolume.storageClass="gp2" \
--set server.persistentVolume.storageClass="gp2"
```
输出的这个地址我们后面会用到。
```bash
NOTES:
The Prometheus server can be accessed via port 80 on the following DNS name from within your cluster:
prometheus-server.prometheus.svc.cluster.local
```
确认 `prometheus` 命名空间中的所有 Pod 均处于 `READY` 状态。
```bash
kubectl get pods -n prometheus
```
输出如下。
```bash
NAME READY STATUS RESTARTS AGE
prometheus-alertmanager-58666cd457-x6n7r 2/2 Running 0 86s
prometheus-kube-state-metrics-5b8f9bdbbd-6hz7m 1/1 Running 0 86s
prometheus-node-exporter-2btvc 1/1 Running 0 87s
prometheus-node-exporter-2mps4 1/1 Running 0 87s
prometheus-node-exporter-lzjbg 1/1 Running 0 87s
prometheus-node-exporter-xxqcm 1/1 Running 0 87s
prometheus-pushgateway-55b7f76c47-rmkb7 1/1 Running 0 86s
prometheus-server-648894fdf8-zlgg4 2/2 Running 0 86s
```
为了访问 prometheus,我们做一下端口转发。
```bash
kubectl port-forward -n prometheus deploy/prometheus-server 8080:9090
```
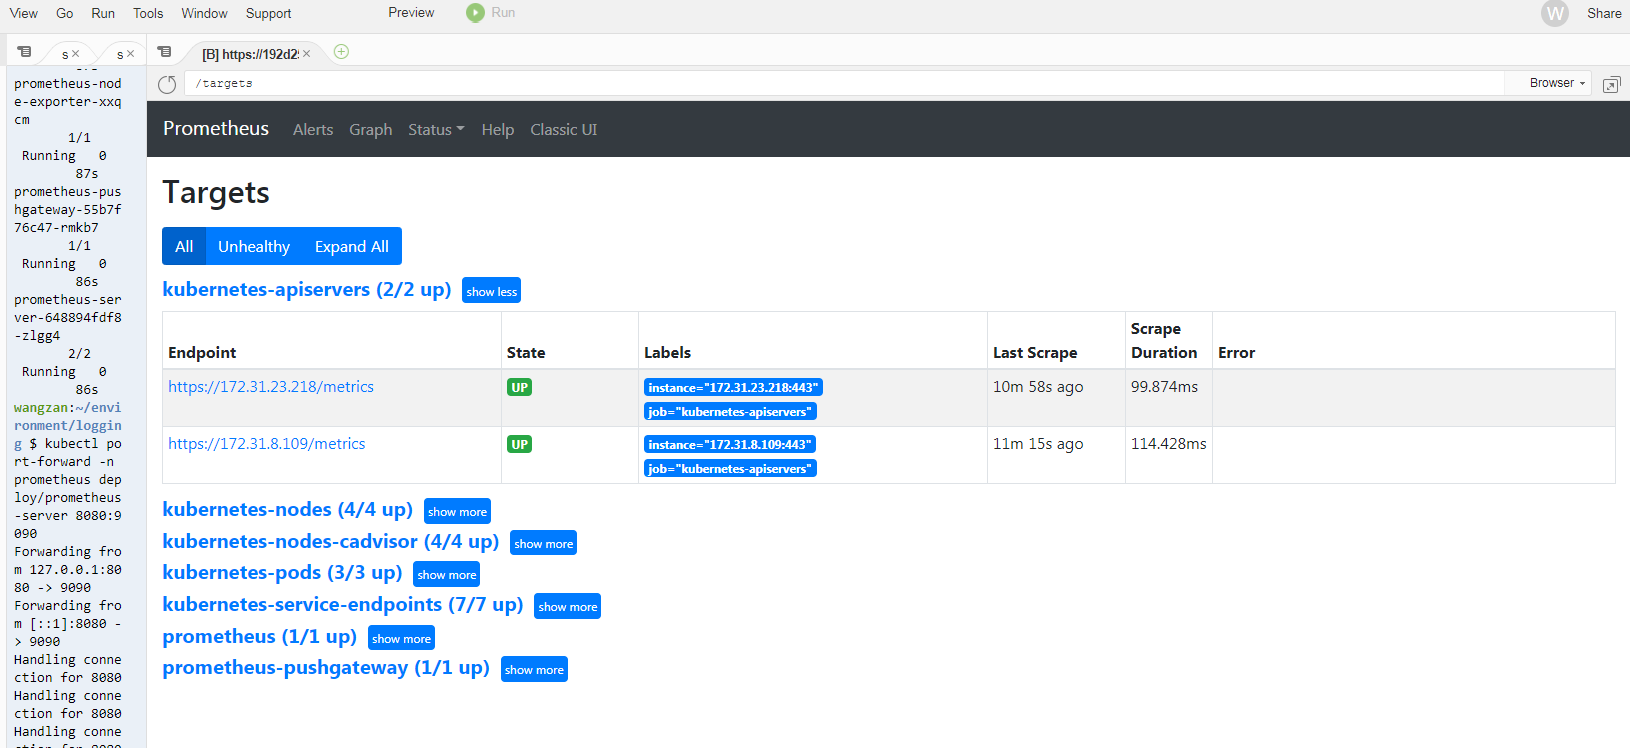
在 Cloud9 环境里面,点击 **Tools / Preview / Preview Running Application**,在 URL 末端添加如下
```bash
/targets
```
可以看到如下信息。
# 部署 Grafana
grafana 也是使用 helm 安装,首先配置好 grafana 的仓库。
```bash
helm repo add grafana https://grafana.github.io/helm-charts
```
然后部署 grafana。
```bash
kubectl create namespace grafanahelm install grafana grafana/grafana \ --namespace grafana \ --set persistence.storageClassName="gp2" \ --set adminPassword='Wangzan@18' \ --set datasources."datasources\.yaml".apiVersion=1 \ --set datasources."datasources\.yaml".datasources[0].name=Prometheus \ --set datasources."datasources\.yaml".datasources[0].type=prometheus \ --set datasources."datasources\.yaml".datasources[0].url=http://prometheus-server.prometheus.svc.cluster.local \ --set datasources."datasources\.yaml".datasources[0].access=proxy \ --set datasources."datasources\.yaml".datasources[0].isDefault=true \ --set service.type=LoadBalancer
```
确定 grafana 是不是部署完成。
```bash
kubectl get all -n grafana
```
输出如下。
```bash
NAME READY STATUS RESTARTS AGEpod/grafana-5d6dcc4b46-dl95q 1/1 Running 0 59sNAME TYPE CLUSTER-IP EXTERNAL-IP PORT(S) AGEservice/grafana LoadBalancer 10.100.53.152 a5cf235fc45974b80bfbece27c104564-1893187232.eu-west-1.elb.amazonaws.com 80:32042/TCP 60sNAME READY UP-TO-DATE AVAILABLE AGEdeployment.apps/grafana 1/1 1 1 60sNAME DESIRED CURRENT READY AGEreplicaset.apps/grafana-5d6dcc4b46 1 1 1 60s
```
直接打开 ELB 的地址即可访问,密码就是我们前面定义的,如果忘记了,可以通过下面命令获取。
```bash
kubectl get secret --namespace grafana grafana -o jsonpath="{.data.admin-password}" | base64 --decode ; echo
```
## 修改为 Ingress
```yaml
apiVersion: networking.k8s.io/v1kind: Ingressmetadata: namespace: grafana name: grafana annotations: kubernetes.io/ingress.class: alb alb.ingress.kubernetes.io/listen-ports: '[{"HTTP": 80}, {"HTTPS": 443}]' alb.ingress.kubernetes.io/target-group-attributes: stickiness.enabled=true,stickiness.lb_cookie.duration_seconds=600 alb.ingress.kubernetes.io/scheme: internet-facing alb.ingress.kubernetes.io/conditions.grafana: > [{"field":"host-header","hostHeaderConfig":{"values":["grafana.wzlinux.com"]}}] alb.ingress.kubernetes.io/group.name: wzlinux alb.ingress.kubernetes.io/ssl-redirect: '443' alb.ingress.kubernetes.io/certificate-arn: arn:aws:acm:eu-west-1:921283538843:certificate/e55a72ae-d9b5-4f77-bf6d-242691105231 alb.ingress.kubernetes.io/target-type: ipspec: rules: - http: paths: - path: / pathType: Prefix backend: service: name: grafana port: number: 80
```
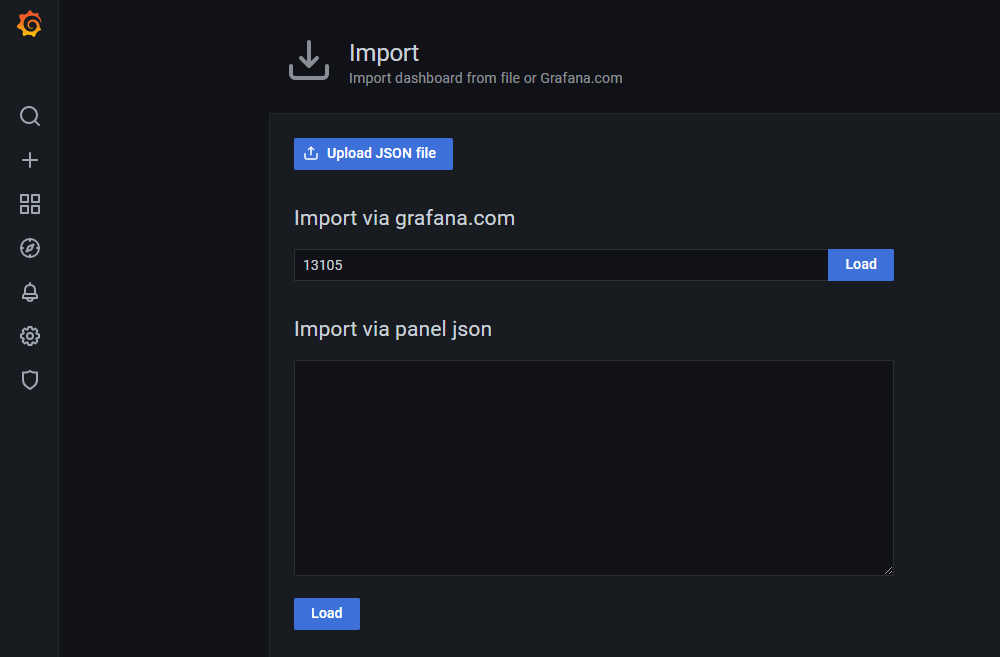
# 配置 Dashboard
点击`+`,选择`import`,然后再[官网](https://grafana.com/grafana/dashboards)查找合适的模版编号。
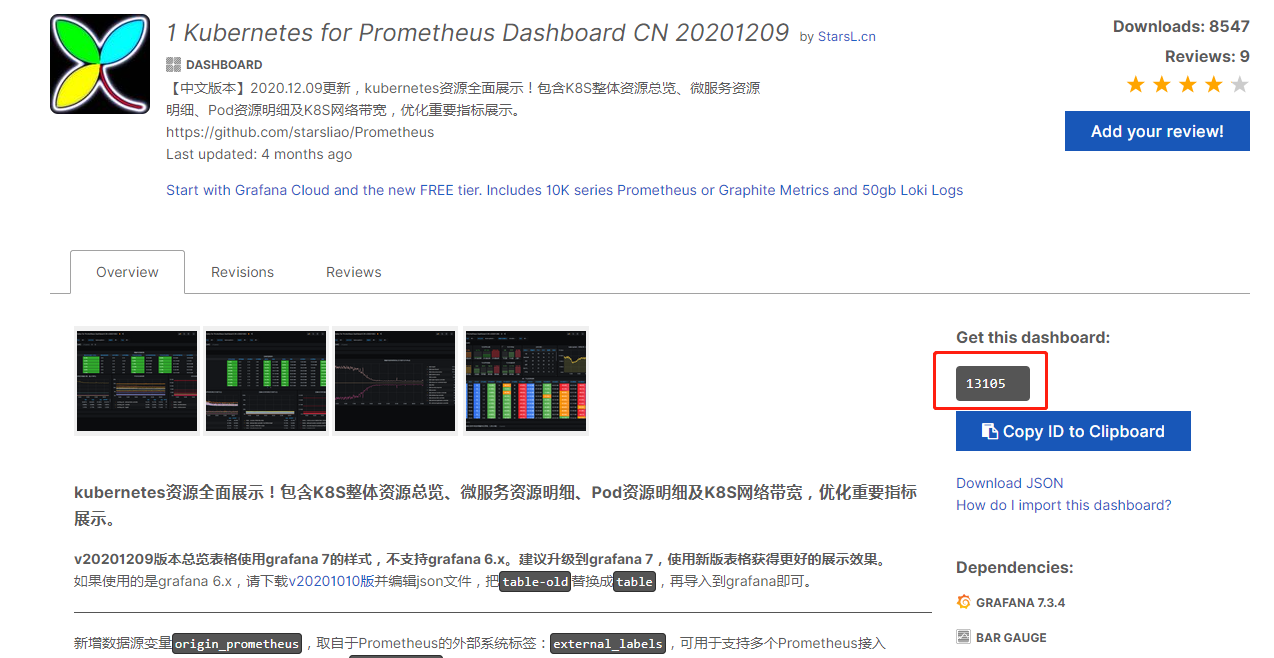
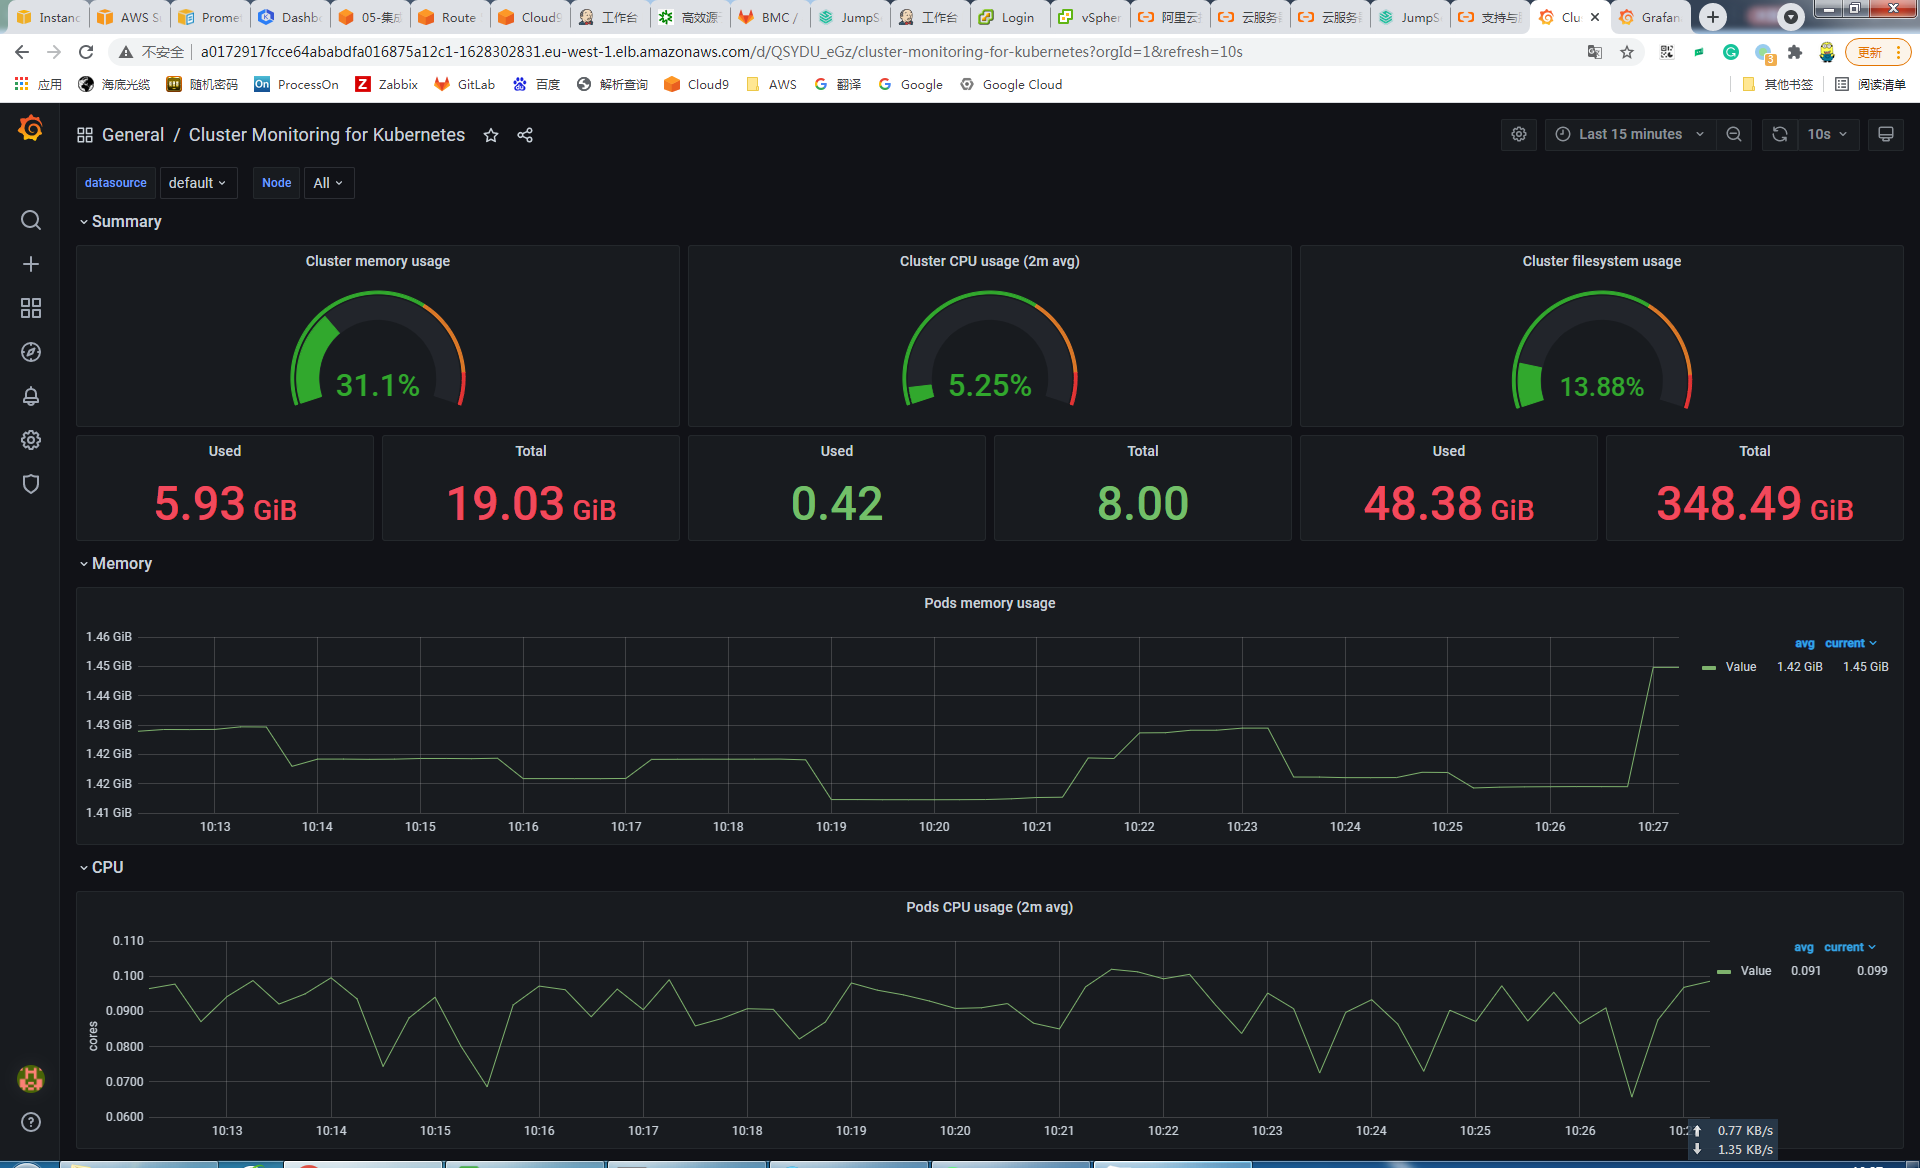
有些模版可能过时了,有些参数数据显示不出来,需要自行调整 PromSQL。
# 欢迎大家扫码关注,获取更多信息

标签:15,datasources,--,训练营,grafana,prometheus,io,EKS,bash 来源: https://blog.51cto.com/wzlinux/2955008