[Matlab] Walking along a path
作者:互联网
Last month I was experimenting with an algorithm in which I needed to construct a set of equidistant steps along a path consisting of line segments. (I'll call this a polyline path, or polyline for short.) Today I want to show you how to construct such a path in MATLAB. Along the way I'll show you the function improfile and give you a pointer to a database of sample range images that I found.
Contents
Polylines
Here's a simple example of a polyline. (Note that, because we're going to be talking about distances, I'm going to set the aspect ratio of my plots to be 1:1 by calling axis equal.)
x = [24 214 327 617];
y = [375 223 218 341];
plot(x,y)
axis
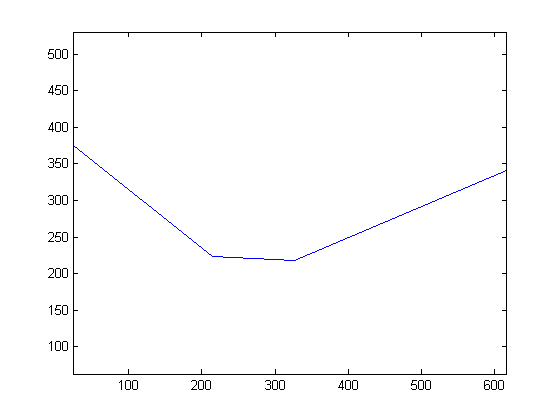
This has three connected line segments. In this example, each segment has a different length. I wanted to be able to find a certain number of points that were equally spaced along this path.
IMPROFILE
After pondering this problem for a minute or so, I remembered that the function improfile does exactly this computation internally. The function improfile is used to compute pixel-value profiles along a user-specified polyline.
Let me illustrate improfile using a range image. In a range image, the pixel values represent estimated distance from the imaging device. I found the USF (University of South Florida) Range Image Database online. Below is a range image I downloaded from the database. It was taken by the Vision Lab at USF using a "K2T structured light camera." (No, I don't know what that is.) The web site helpfully tells me that the image is stored in "rasterfile format," which is pretty dated but fortunately supported by imread.
url = ;
I = imread(url, );
imshow(I, , 50)
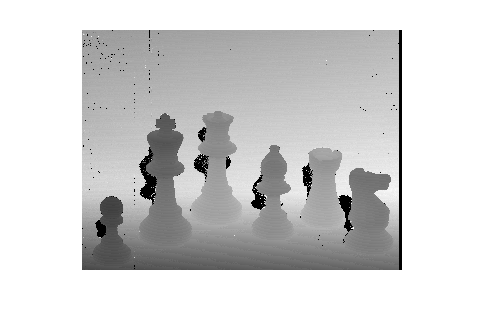
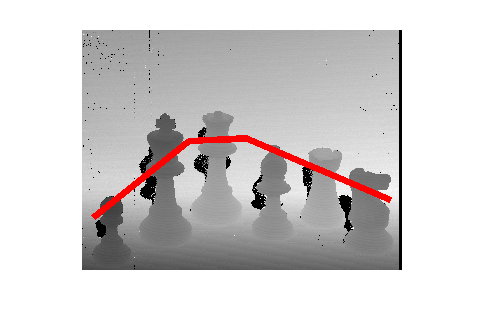
Let's use improfile to compute a cross-section of range values along a particular path. First, though, let me superimpose the path on the image so you can where it is. (Although improfile has an interactive mode that lets you select the path using a mouse, I can't show that here.)
hold
plot(x,y,,,5)
hold
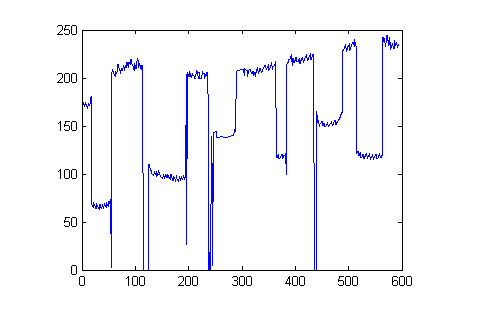
Here's the cross-section of range values.
improfile(I,x,y)
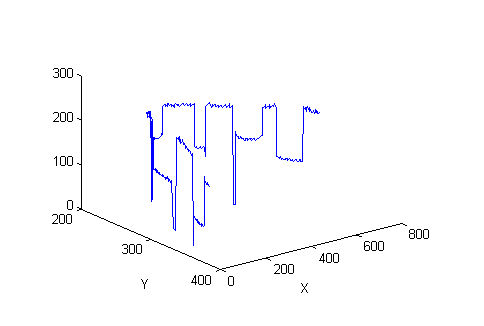
You can see that improfile shows the cross-section as a 3-D plot. To see the cross-section as a normal 2-D line plot, call improfile with an output argument to get the cross-section values and then pass them to plot.
c = improfile(I,x,y);
plot(c)
Computing equidistant steps along the polyline
As part of its computation, improfile needs to compute equidistant steps along the polyline path. So how does that work?
The function first computes the cumulative distance from the beginning of the polyline to each vertex along the way, and then it uses a clever call to interp1 to compute the steps.
xy = [x' y'];
d = diff(xy,1)
dist_from_vertex_to_vertex = hypot(d(:,1), d(:,2))
cumulative_dist_along_path = [0;
    cumsum(dist_from_vertex_to_vertex,1)]
Now we can get our steps by constructing a call to interp1.
num_points = 20;
dist_steps = linspace(0, cumulative_dist_along_path(end), num_points);
points = interp1(cumulative_dist_along_path, xy, dist_steps)
Plot the points, superimposing them on the original path, to see how we did.
plot(x,y)
hold
plot(points(:,1), points(:,2), )
hold
axis
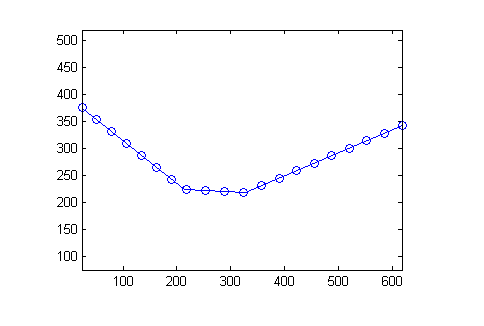
There you go. Now you know about improfile, you know how to compute a path along a polyline, and you know about an online database of sample range imagery.
I think we should call it a day.
From: Steve on Image Processing
posted on 2012-07-13 11:28 Shicai Yang 阅读(...) 评论(...) 编辑 收藏转载于:https://www.cnblogs.com/youth0826/archive/2012/07/13/2589904.html
标签:plot,Walking,improfile,steps,polyline,path,along 来源: https://blog.csdn.net/weixin_30877755/article/details/98950822