pandas GroupBy
作者:互联网
Pandas groupby 是pandas的灵魂之一, 就像excel 里我们可以简单的去求 mean,如果让你按照月份去求 mean,这时需要 groupby date 然乎利用 mean() 函数,
一个不错的推文 Pandas GroupBy 深度总结
5种 groupby 技巧,实际使用用所涉及的技巧远远多于这五个技巧。
首先导入数据:数据原来于 data github
import pandas as pd
df = pd.read_csv("Dummy_Sales_Data_v1.csv")
df.head()
直接使用 .groupby(),将会返回一个 GroupBy 对象,其实它是一个字典 , key 是 被划分的每个唯一的值, value是 GroupBy 中未提及的一些数值。
df_group = df.groupby("Product_Category")
type(df_group)
# Output
pandas.core.groupby.generic.DataFrameGroupBy
分组数(Number of Groups)
使用groupby 之后,我们想知道划分出了多少个组:
df.Product_Category.nunique()
-- Output
5
或者
df_group = df.groupby("Product_Category")
df_group.ngroups
-- Output
5
小组内计数(Group Sizes)
统计分组内每个小组数据的个数,可以使用.size()
df.groupby("Product_Category").size()
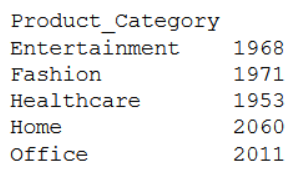
这个和count计数效果其实差不多:
df.groupby("Product_Category").count()
在pandas中 agg 函数中
.count()仅仅针对 non-null 进行计数,.size()则返回每个小组内可用的行数,而不去看具体的values 是否是 non-null 。

分组第一行
查看每个分组下的第一行:
df.groupby("Product_Category").first()

查看每个分组下的最后一行:
df.groupby("Product_Category").last()
如果想查看每个分组下地第三行:
df.groupby("Product_Category").nth(3) # 分组第三行
df.groupby("Product_Category").nth(0) # 分组第一行
df.groupby("Product_Category").nth(-1) # 分组最后一行
那 .first() 与 .nth(0) 有什么差异?
.first()会返回第一行 non-null的行,.nth(0)返回的行 可以是null,.nth(0)并不关注这行是否是 null。同样适用于 .last()
抓取分组(get_group)
get_group() 可以从 Groupby 对象中得到具体的分组。
df_group.get_group('Healthcare')

我们也可以通过切片查找 Product_Category == 'Home' 的数据,当然也可以使用 groupby
# slice
df[df["Product_Category"]=='Home']

# groupby
# groupby 是 更高效的,用时是slice的 1/4
df_group = df.groupby("Product_Category")
df_group.get_group('Home')
如果想要对.get_group() 输入多个value,这时需要写一个 for loop 如何去定义 value ? 我们之前提及到 GroupBy 是一个字典:
for name_of_group, contents_of_group in df_group:
    print(name_of_group)
    print(contents_of_group)

agg 多列用不同的函数
对比每个 product category 计算平均价格 和 平均质量
#Create a groupby object
df_group = df.groupby("Product_Category")
#Select only required columns
df_columns = df_group[["UnitPrice(USD)","Quantity"]]
#Apply aggregate function
df_columns.mean()
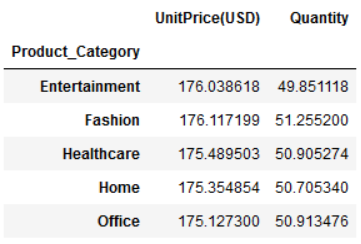
我们还可以添加更多的列, 使用agg函数,
.min(),.max(),.count(),.median(),.std()
可以将上述三行codes变成一行:
df.groupby("Product_Category")[["UnitPrice(USD)","Quantity"]].mean()
使用 agg 函数:
df.groupby("Product_Category")[["Quantity"]].aggregate([min,
                                                  max,
                                                  sum,
                                                  'mean'])
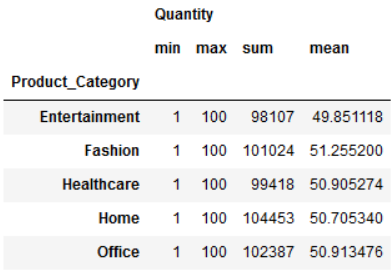
为什么最后使用了 'mean'?当我们使用 agg 函数时,其实本质时时调用 pd.DataFrame 自带的函数 或者使用 DataFrame.apply() 。对于'mean' 时, .aggregate() 将会搜索python中默认的mean函数, 调用了 pd.Series.mean()
我们也可对不同的列使用不同的函数:
function_dictionary = {'OrderID':'count','Quantity':'mean'}
df.groupby("Product_Category").aggregate(function_dictionary)
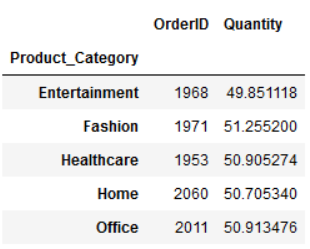
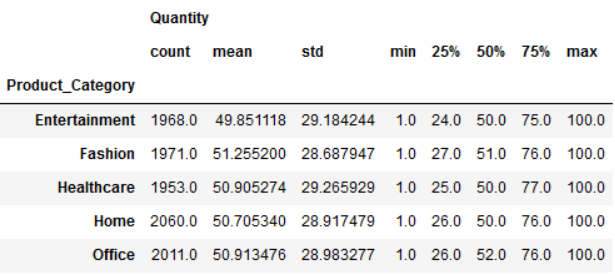
我们也可以通过 .describe() 做一些基础的描述性统计, 包括 count, mean, std, min, max 和 median。
df.groupby("Product_Category")[["Quantity"]].describe()
END
标签:Category,Product,group,df,pandas,GroupBy,groupby,mean 来源: https://www.cnblogs.com/RankFan/p/16618546.html