C#中统计图控件的使用(ZedGraph)
作者:互联网
本篇内容来自https://www.cnblogs.com/gaizai/archive/2010/02/22/1671154.html
开源的统计图控件中基本常用的是OpenFlashChar和ZedGraph,今天就先来讲讲ZedGraph的使用。
ZedGraph资源
- ZedGraph来源:http://sourceforge.net/project/showfiles.php?group_id=114675
- ZedGraph相关例子资源:http://zedgraph.org/wiki/index.php?title=Sample_Graphs
ZedGraph的特点:
- 第一,可以先生成图片后再显示,这对一些多用户并发有点帮助。(RenderMode.ImageTag)
- 第二,可以动态生成,不用保存文件,可以减少IO的读写消耗。(RenderMode.RawImage)
- 第三,比较多的呈现方式,比如曲线图、柱状图、饼图等。
ZedGraph的缺点:
- 第一,编码的时候,在设置属性时太烂了,一点注释都没有,不要说是中文的啦,就连英文都没有,太不方便了。
- 第二,图表的显示比较简陋,没有OpenFlashChar来得好看。
注意事宜
- 第一,当前的最新版本是5.1.5,我以前也使用过4.3.4的版本,这两个版本的差别很大,很多属性都已经不存在了,面向对象的感念可能加强了不少,也清晰了不少,因为现在的属性设置都是先实体,再属性了,而以前就比较混乱了。所以在使用不同的版本的时候要注意这点。
- 第二,在Windows Forms和 ASP.Net Web Form中使用是不同。
一个简单的入门例子
- 第一,在 bin文件夹中加入 Zedgraph.dll 和Zedgraph.web.dll;
- 第二,添加这两个dll的引用;
- 第三,在网站下要创建一个空文件夹,名称为 'ZedGraphImages',这个文件夹名称是默认的,要修改这个文件夹名称,可以修改属性 RenderedImagePath,CacheDuration缓存的持续时间。ZedGraph会生成一图片存放在缓存的目录中,显示图片时,会生成一个img标签代替ZedGraphWeb标签,并在一个时间内,"欺骗"浏览器加载这张图片;
- 第四,在 aspx文件中加入:<%@ Register TagPrefix="zgw" Namespace="ZedGraph.Web" Assembly="ZedGraph.Web" %>;在html中加入<zgw:ZedGraphWeb ID="ZedGraphWeb1" runat="server" Width="300" Height="130" RenderMode="ImageTag"></zgw:ZedGraphWeb>
- 第五,在cs文件中添加引用: using ZedGraph;using ZedGraph.Web;using System.Drawing;//颜色
- 第六,注册事件,this.ZedGraphWeb1.RenderGraph += new ZedGraph.Web.ZedGraphWebControlEventHandler(GetImage);//注册事件
- 第七,写方法,private void GetImage(ZedGraphWeb zgw, Graphics g, MasterPane masterPane){}
- 具体代码可以参考ZedGraph webform 初学小例子 (代码有详细解释)
一些经验
- 传递数据的时候可以使用字典:IDictionary<int, int> dic;
- 一些属性设置
myPane.YAxis.Scale.FontSpec.Size = 30;//设置y轴的文字大小.
myPane.YAxis.MajorGrid.IsVisible = true;//设置虚线.
myPane.Chart.Border.IsVisible = false;//图表区域的边框设置.
myPane.Legend.IsVisible = false;//图表的注释标签显示设置项目.
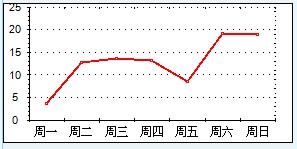
- 动态根据传入的数据显示的方法
        /// <summary>
        /// 曲线图.
        /// </summary>
        public void CreateLineChart(GraphPane myPane, IDictionary<int, int> dic, string title, string xField, string yFields, string format)
        {
            myPane.XAxis.Scale.FontSpec.Size = 30;//设置x轴的文字大小.
            myPane.YAxis.Scale.FontSpec.Size = 30;//设置y轴的文字大小.
            myPane.YAxis.MajorGrid.IsVisible = true;//设置虚线.
            myPane.Chart.Border.IsVisible = false;//图表区域的边框设置.
            myPane.Legend.IsVisible = false;//图表的注释标签显示设置项目.

            int rows = dic.Count;
            double[] arrY = new double[rows];
            double[] arrX = new double[rows];
            string[] labels = new string[rows];

            int i = 0;
            foreach (KeyValuePair<int, int> kvp in dic)
            {
                arrX[i] = Convert.ToDouble(kvp.Key);
                arrY[i] = Convert.ToDouble(kvp.Value);
                labels[i] = kvp.Key.ToString();
                i++;
            }

            LineItem myCurve = myPane.AddCurve(title, arrX, arrY, Color.Red, SymbolType.Square);
            myCurve.Symbol.Fill = new Fill(Color.Blue, Color.White, Color.Blue);//填充这个蓝条,让这蓝条看起来有3D的效果
            myCurve.Line.Width = 2;

            myPane.XAxis.Scale.TextLabels = labels; //X轴的说明文字
            myPane.XAxis.Type = AxisType.Text;
        }
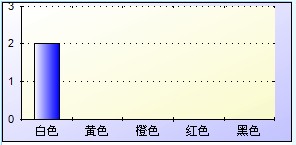
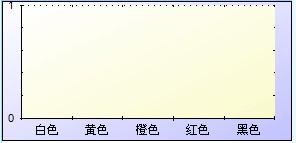
- 小图的属性设置
myPane.YAxis.Scale.FontSpec.Size = 30;//设置y轴的文字大小.
myPane.YAxis.MajorGrid.IsVisible = true;//设置虚线.
myPane.Chart.Border.IsVisible = false;//图表区域的边框设置.
myPane.Legend.IsVisible = false;//图表的注释标签显示设置项目.
- 小图的属性设置刻度问题
myPane.YAxis.Scale.MajorStep = 1;//设置刻度为1;
- 属性分布图,From Arbean.Wu
相关资料
- http://weblogs.asp.net/scottgu/archive/2008/11/24/new-asp-net-charting-control-lt-asp-chart-runat-quot-server-quot-gt.aspx
- http://zedgraph.org/wiki/index.php?title=Sample_Graphs
- 波浪线图:http://zedgraph.org/wiki/index.php?title=Dual-Y_Demo
- RenderMode.ImageTag例子:http://zedgraph.org/wiki/index.php?title=Use_RenderMode.ImageTag_in_a_web_page
RenderMode.RawImage例子:http://zedgraph.org/wiki/index.php?title=Use_RenderMode.RawImage_in_a_web_page -
ZedGraph webform 初学小例子 (代码有详细解释)
一个简单例子 - 开源图表控件ZedGraph控件的研究(1)
- ZedGraph属性\方法介绍
标签:控件,Scale,ZedGraph,C#,统计图,YAxis,设置,IsVisible,myPane 来源: https://www.cnblogs.com/wzhk009/p/14200519.html