Benchmarking Apache Kafka, Apache Pulsar, and RabbitMQ: Which is the Fastest?
作者:互联网
Apache Kafka® is one of the most popular event streaming systems. There are many ways to compare systems in this space, but one thing everyone cares about is performance. Kafka has been known to be fast, but how fast is it today, and how does it stack up against other systems? We decided to test Kafka’s performance on the latest cloud hardware to find out.
For comparisons, we chose a traditional message broker, RabbitMQ, and one of the Apache BookKeeper™ based message brokers, Apache Pulsar. We focused on (1) system throughput and (2) system latency, as these are the primary performance metrics for event streaming systems in production. In particular, the throughput test measures how efficient each system is in utilizing the hardware, specifically the disks and the CPU. The latency test measures how close each system is to delivering real-time messaging including tail latencies of up to p99.9th percentile, a key requirement for real-time and mission-critical applications as well as microservices architectures.
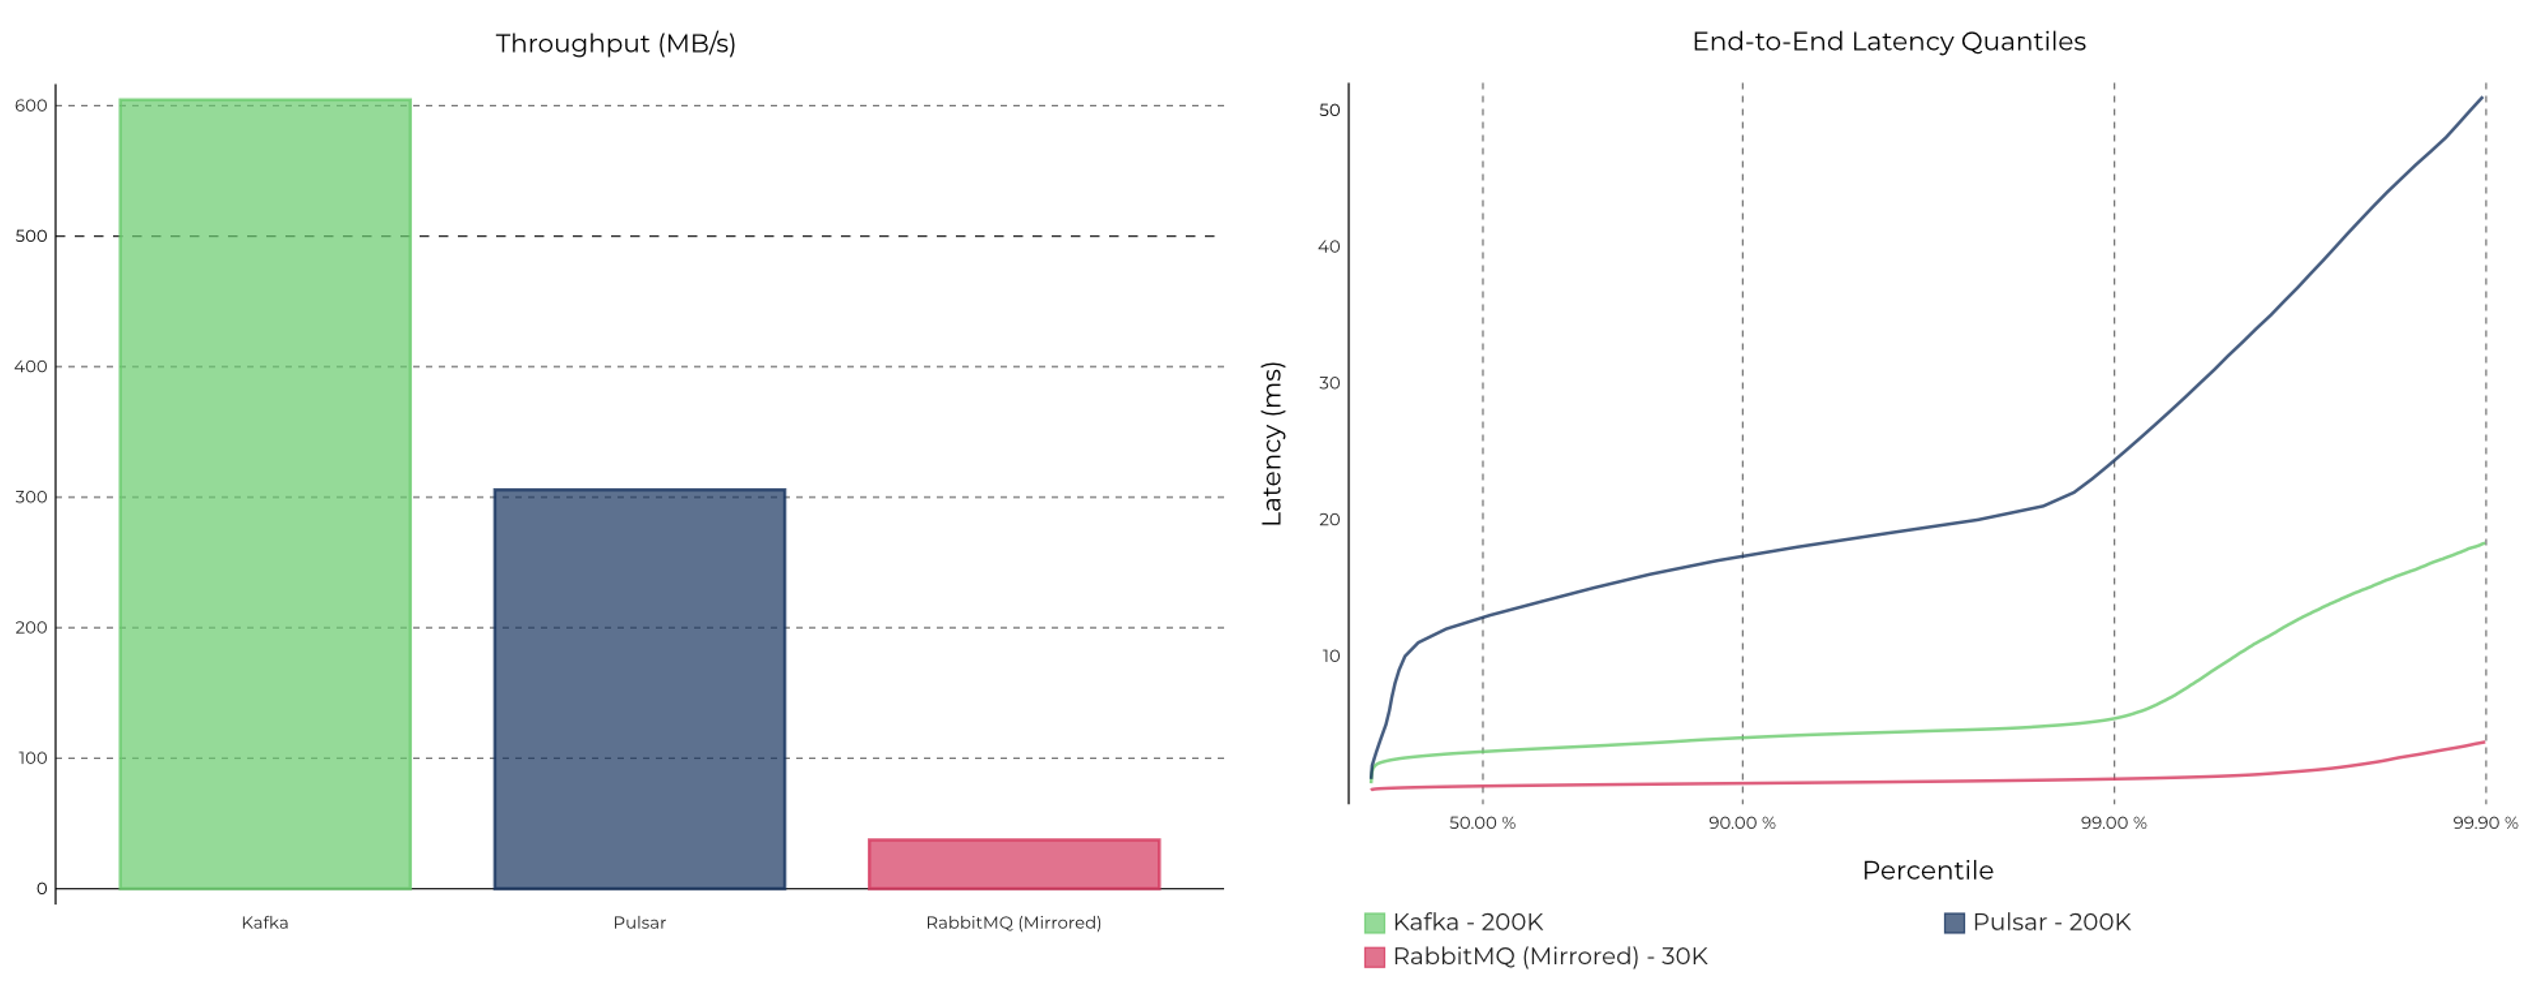
We found that Kafka delivers the best throughput while providing the lowest end-to-end latencies up to the p99.9th percentile. At lower throughputs, RabbitMQ delivers messages at very low latencies.
| Kafka | Pulsar | RabbitMQ (Mirrored) |
|
| Peak Throughput (MB/s) |
605 MB/s |
305 MB/s |
38 MB/s |
| p99 Latency (ms) |
5 ms (200 MB/s load) |
25 ms (200 MB/s load) |
1 ms* (reduced 30 MB/s load) |
*RabbitMQ latencies degrade significantly at throughputs higher than the 30 MB/s. Furthermore, the impact of mirroring is significant at higher throughput and better latencies can be achieved by using just classic queues without mirroring.
This blog post is structured to first walk you through the benchmarking framework we used, followed by a description of the testbed and the workloads. It will finish with an explanation of the results using the various system and application metrics. All of these are open source, so curious readers can reproduce the results for themselves or dig deeper into the collected Prometheus metrics. As with most benchmarks, we compare performance on a setup for a specific workload. We always encourage readers to compare using their own workloads/setups, to understand how these translate to production deployments. For a deeper look at features, architecture, ecosystem, and more, read this complete guide comparing Kafka, Pulsar, and RabbitMQ.
Overview
- Background
- Durability in distributed systems
- Benchmarking Framework
- Testbed
- Throughput test
- Latency test
- Summary
Background
First, let’s discuss each of the systems briefly to understand their high-level design and architecture, looking at the trade-offs each system makes.
Kafka is an open source distributed event streaming platform, and one of the five most active projects of the Apache Software Foundation. At its core, Kafka is designed as a replicated, distributed, persistent commit log that is used to power event-driven microservices or large-scale stream processing applications. Clients produce or consume events directly to/from a cluster of brokers, which read/write events durably to the underlying file system and also automatically replicate the events synchronously or asynchronously within the cluster for fault tolerance and high availability.
Pulsar is an open-source distributed pub/sub messaging system originally catered towards queuing use cases. It recently added event streaming functionality as well. Pulsar is designed as a tier of (almost) stateless broker instances that connect to a separate tier of BookKeeper instances, which actually read/write and, optionally, store/replicate the messages durably. Pulsar is not the only system of its kind as there are also other messaging systems like Apache DistributedLog and Pravega, which have been created on top of BookKeeper and aim to also provide some Kafka-like event streaming functionality.
BookKeeper is an open-source distributed storage service that was originally designed as a write-ahead log for Apache™ Hadoop®’s NameNode. It provides persistent storage of messages in ledgers, across server instances called bookies. Each bookie synchronously writes each message to a local journal log for recovery purposes and then asynchronously into its local indexed ledger storage. Unlike Kafka brokers, bookies do not communicate with each other and it’s the BookKeeper clients that are responsible for replicating the messages across bookies using a quorum-style protocol.
RabbitMQ is an open-source traditional messaging middleware that implements the AMQP messaging standard, catering to low-latency queuing use cases. RabbitMQ consists of a set of broker processes that host “exchanges” for publishing messages to and queues for consuming messages from. Availability and durability are properties of the various queue types offered. Classic queues offer the least availability guarantees. Classic mirrored queues replicate messages to other brokers and improve availability. Stronger durability is provided through the more recently introduced quorum queues but at the cost of performance. Since this is a performance-oriented blog post, we restricted our evaluation to classic and mirrored queues.
Durability in distributed systems
Single-node storage systems (e.g., RDBMS) depend on fsyncing writes to disk to ensure maximal durability. But in distributed systems, durability typically comes from replication, with multiple copies of the data that fail independently. Fsyncing data is just a way of reducing the impact of the failure when it does occur (e.g., fsyncing more often could lead to lower recovery time). Conversely, if enough replicas fail, a distributed system may be unusable regardless of fsync or not. Hence, whether we fsync or not is just a matter of what guarantees each system chooses to depend on for its replication design. While some depend closely on never losing data written to disk, thus requiring fsync on every write, others handle this scenario in their design.
Kafka’s replication protocol was carefully designed to ensure consistency and durability guarantees without the need for synchronous fsync by tracking what has been fsynced to the disk and what hasn’t. By assuming less, Kafka can handle a wider range of failures like filesystem-level corruptions or accidental disk de-provisioning and does not take for granted the correctness of data that is not known to be fsync’d. Kafka is also able to leverage the OS for batching writes to the disk for better performance.
We have not been able to ascertain categorically whether BookKeeper offers the same consistency guarantees without fsyncing each write—specifically, whether it can rely on replication for fault tolerance in the absence of synchronous disk persistence. This isn’t covered in the documentation or a write-up on the underlying replication algorithm. Based on our inspection and the fact that BookKeeper implements a grouped fsync algorithm, we believe it does rely on fsyncing on each write for its correctness, but we’d love to hear from folks in the community who might know better if our conclusion is correct.
In any case, since this can be somewhat of a controversial topic, we’ve given results in both cases to ensure we are being as fair and complete as possible, though running Kafka with synchronous fsync is extremely uncommon and also unnecessary.
Benchmarking framework
With any benchmark, one wonders what framework is being used and if it’s fair. To that end, we wanted to use the OpenMessaging Benchmark Framework (OMB), originally authored, in large parts, by Pulsar contributors. OMB was a good starting point with basic workload specification, metrics collection/reporting for the test results, support for the three chosen messaging systems as well as a modular cloud deployment workflow tailored for each system. But of note, Kafka and RabbitMQ implementations did have some significant shortcomings that affected the fairness and reproducibility of these tests. The resulting benchmarking code including the fixes described in more detail below are available as open source.
Fixes to the OMB Framework
We upgraded to Java 11 and Kafka 2.6, RabbitMQ 3.8.5, and Pulsar 2.6 (the latest releases at the time of writing). We significantly enhanced the monitoring capabilities across the three systems, with the Grafana/Prometheus monitoring stack, capturing metrics across messaging systems, JVM, Linux, disk, CPU, and network. This was critical for being able to not just report results but explain them. We have added support for producer-only tests and consumer-only tests with support for generating/draining backlogs, while also fixing an important bug with producer rate calculation when the number of topics is smaller than the number of producer workers.
Fixes to the OMB Kafka driver
We fixed a critical bug in the Kafka driver that starved Kafka producers of TCP connections, bottlenecking on a single connection from each worker instance. The fix makes the Kafka numbers fair, compared to other systems—that is, all of them now use the same number of TCP connections to talk to their respective brokers. We also fixed a critical bug in the Kafka benchmark consumer driver, where offsets were being committed too frequently and synchronously causing degradation, whereas it was done asynchronously for other systems. We also tuned the Kafka consumer fetch size and replication threads to eliminate bottlenecks in message fetching at high throughputs and to configure the brokers equivalent to the other systems.
Fixes to the OMB RabbitMQ driver
We enhanced RabbitMQ to use routing keys and configurable exchange types (DIRECT and TOPIC exchanges) and also fixed a bug in the RabbitMQ cluster setup deployment workflow. Routing keys were introduced to mimic the concept of partitions per topic, equivalent to the setup on Kafka and Pulsar. We added a TimeSync workflow for the RabbitMQ deployment to synchronize time across client instances for precise end-to-end latency measurements. In addition, we fixed another bug in the RabbitMQ driver to ensure accurate end-to-end latency measurement.
Fixes to the OMB Pulsar driver
For the OMB Pulsar driver, we added the ability to specify a maximum batching size for the Pulsar producer and turned off any global limits that could artificially limit throughput at higher target rates for producer queues across partitions. We did not need to make any other major changes to Pulsar benchmark drivers.
Testbed
OMB contains testbed definitions (instance types and JVM configs) and workload driver configurations (producer/consumer configs and server-side configs) for its benchmarks, which we used as the basis for our tests. All tests deploy four worker instances to drive workload, three broker/server instances, one monitoring instance, and optionally a three-instance Apache ZooKeeper cluster for Kafka and Pulsar. After experimenting with several instance types, we settled on the network/storage-optimized class of Amazon EC2 instances, with enough CPU cores and network bandwidth to support disk I/O bound workloads. In the sections below, we call out any changes we have made to these baseline configurations, along the way for different tests.
Disks
Specifically, we went with the i3en.2xlarge (with 8 vCores, 64 GB RAM, 2 x 2,500 GB NVMe SSDs) for its high 25 Gbps network transfer limit that ensures that the test setup is not network bound. This means that the tests measure the respective maximum server performance measures, not simply how fast the network is. i3en.2xlarge instances support up to ~655 MB/s of write throughput across two disks, which is plenty to stress the servers. See the full instance type definition for details. Per the general recommendation and also per the original OMB setup, Pulsar uses one of the disks for journaling and one for ledger storage. No changes were made to the disk setups of Kafka and RabbitMQ.
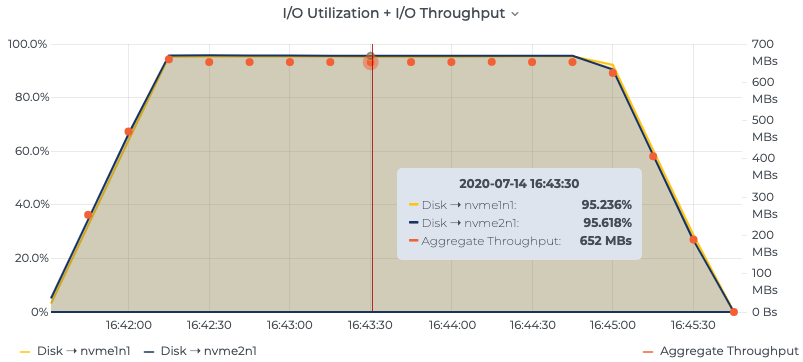 Figure 1. Establishing the maximum disk bandwidth of
 i3en.2xlarge instances across two disks, tested using the dd Linux command, to serve as a north star for throughput tests
Disk 1
dd if=/dev/zero of=/mnt/data-1/test bs=1M count=65536 oflag=direct
65536+0 records in
65536+0 records out
68719476736 bytes (69 GB) copied, 210.278 s, 327 MB/s

Disk 2
dd if=/dev/zero of=/mnt/data-2/test bs=1M count=65536 oflag=direct
65536+0 records in
65536+0 records out
68719476736 bytes (69 GB) copied, 209.594 s, 328 MB/s
OS tuning
Additionally, for all three of the compared systems, we tuned the OS for better latency performance using tuned-adm’s latency performance profile, which disables any dynamic tuning mechanisms for disk and network schedulers and uses the performance governor for CPU frequency tuning. It pegs the p-states at the highest possible frequency for each core, and it sets the I/O scheduler to the deadline to offer a predictable upper bound on disk request latency. Finally, it also tunes the power management quality of service (QoS) in the kernel for performance over power savings.
Memory
The i3en.2xlarge test instances have almost half the physical memory (64 GB vs. 122 GB) compared to the default instances in OMB. Tuning Kafka and RabbitMQ to be compatible with the test instances was simple. Both rely primarily on the operating system’s page cache, which automatically gets scaled down with the new instance.
However, Pulsar brokers as well as BookKeeper bookies rely on off-heap/direct memory for caching, and we sized the JVM heap/maximum direct memory for these two separate processes to work well on i3en.2xlarge instances. Specifically, we halved the heap size from 24 GB each (in the original OMB configuration) to 12 GB each, proportionately dividing available physical memory amongst the two processes and the OS.
In our testing, we encountered java.lang.OutOfMemoryError: Direct buffer memory errors at high-target throughputs, causing bookies to completely crash if the heap size was any lower. This is typical of memory tuning problems faced by systems that employ off-heap memory. While direct byte buffers are an attractive choice for avoiding Java GC, taming them at a high scale is a challenging exercise.
Throughput test
The first thing we set out to measure was the peak stable throughput each system could achieve, given the same amount of network, disk, CPU, and memory resources. We define peak stable throughput as the highest average producer throughput at which consumers can keep up without an ever-growing backlog.
Effect of fsync
As mentioned earlier, the default, recommended configuration for Apache Kafka is to flush/fsync messages to disk using the page cache flush policy dictated by the underlying OS (instead of fsyncing every message synchronously) and to rely on replication for durability. Fundamentally, this provides a simple and effective way to amortize the cost of different batch sizes employed by Kafka producers to achieve maximum possible throughput under all conditions. If Kafka were configured to fsync on each write, we would just be artificially impeding the performance by forcing fsync system calls, without any additional gains.
That said, it may still be worthwhile understanding the impact of fsyncing on each write in Kafka, given that we are going to discuss results for both cases. The effect of the various producer batching sizes on Kafka throughput is shown below. Throughput increases with increases in batch size before reaching a “sweet spot,” where the batch size is high enough to fully saturate the underlying disks. Fsyncing every message to disk on Kafka (orange bars in Figure 2) yields comparable results for higher batch sizes. Note that these results have been verified only on the SSDs in the described testbed. Kafka does make full use of the underlying disks across all batch sizes, either maximizing IOPS at lower batch sizes or disk throughput at higher batch sizes, even when forced to fsync every message.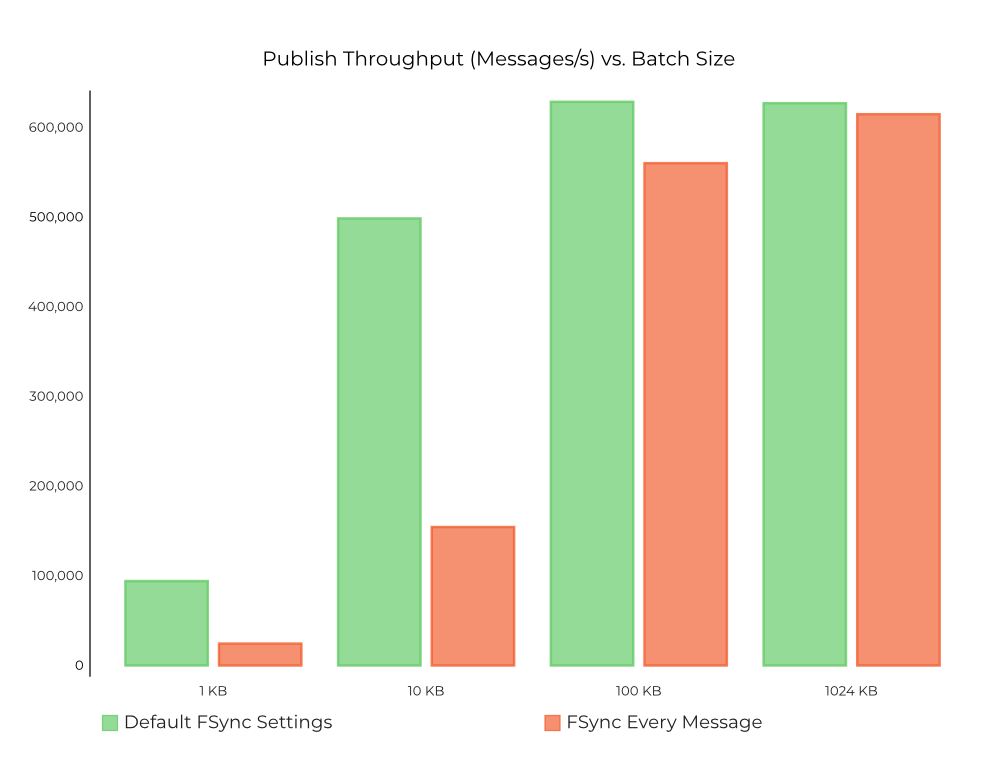 Figure 2. Effect of batch size on throughput in messages/s in Kafka, with green bars denoting fsync=off (default) and orange bars denoting fsync every message, respectively
That said, from the chart above, it is evident that using the default fsync settings (green bars) allows the Kafka broker to better manage the page flushes to provide a better throughput overall. Particularly, the throughput with the default sync settings for lower producer batch sizes (1 KB and 10 KB) is ~3–5x higher than what was achieved by fsyncing every message. With larger batches (100 KB and 1 MB), however, the cost of fsyncing is amortized and the throughput is comparable to the default fsync settings.
Pulsar implements similar batching on the producers and does quorum-style replication of produced messages across bookies. BookKeeper bookies implement grouped commit/syncing to disk at the application level to similarly maximize the disk throughput. BookKeeper, by default (controlled by the journalSyncData=true bookie config), fsyncs writes to the disk.
To cover all bases, we tested Pulsar with journalSyncData=false configured on BookKeeper for an apples-to-apples comparison with Kafka’s default and recommended setting of not fsyncing on every individual message. However, we encountered large latencies and instability on the BookKeeper bookies, indicating queueing related to flushing. We also verified the same behavior using the pulsar-perf tool that ships with Pulsar. As far as we can tell, after consulting the Pulsar community, this appears to be a bug so we chose to exclude it from our tests. Nonetheless, given we could see the disks being maxed out on throughput with journalSyncData=true, we believe it will not affect the final outcomes anyway.
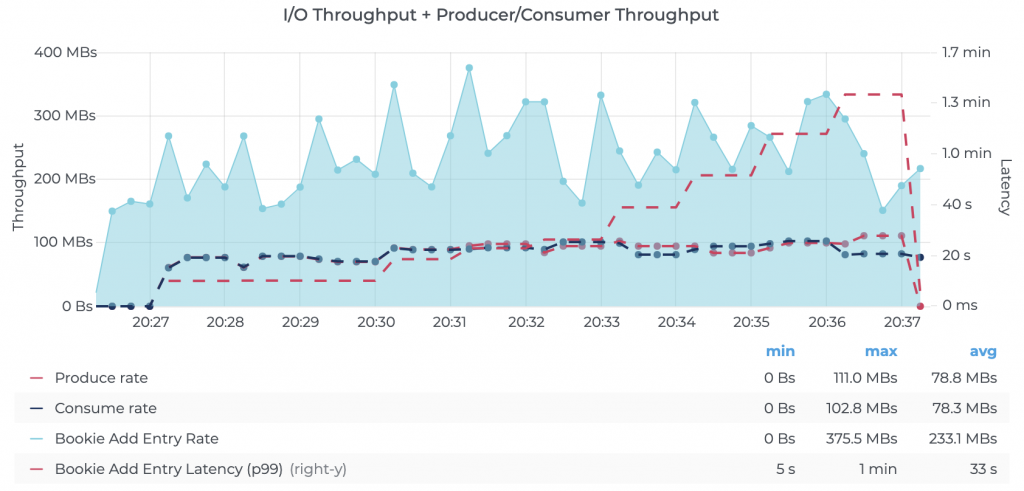 Figure 3. Illustration of Pulsar’s performance with BookKeeper’s
 journalSyncData=false, showing throughput drops and latency spikes
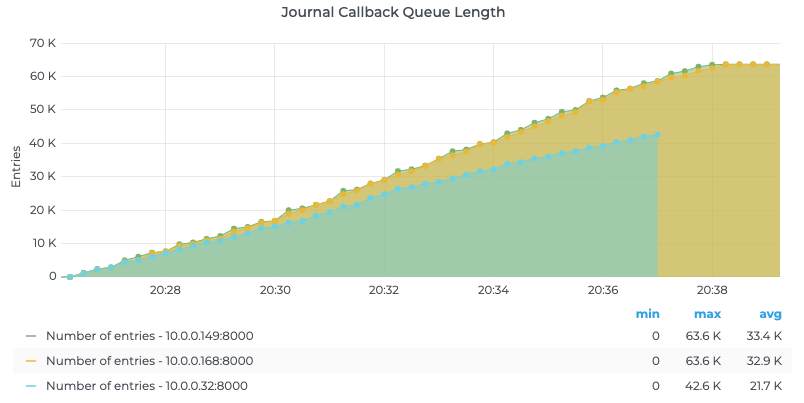 Figure 4. BookKeeper journal callback queue growth with
 journalSyncData=false
RabbitMQ operates with a durable queue that persists messages to the disk if and only if the messages have not already been consumed. Unlike Kafka and Pulsar, however, RabbitMQ does not support ‘rewinding’ of queues to read older messages yet again. From a durability standpoint, our benchmarks indicated that the consumer kept up with the producer, and thus we did not notice any writes to the disk. We also set up RabbitMQ to deliver the same availability guarantees as Kafka and Pulsar by using mirrored queues in a cluster of three brokers.
Test setup
The experiment was designed according to the following principles and expected guarantees:
- Messages are replicated 3x for fault tolerance (see below for specific configs).
- We enable batching for all three systems to optimize for throughput. We batch up to 1 MB of data for a maximum of 10 ms.
- Pulsar and Kafka were configured with 100 partitions across one topic.
- RabbitMQ does not support partitions in a topic. To match the Kafka and Pulsar setup, we declared a single direct exchange (equivalent to a topic) and linked queues (equivalent to partitions). More specifics on this setup can be found below
OMB uses an auto-rate discovery algorithm that derives the target producer throughput dynamically by probing the backlog at several rates. We saw wild swings in the determined rate going from 2.0 messages/s to 500,000 messages/s in many cases. These hurt the repeatability and fidelity of the experiments significantly. In our experiments, we explicitly configured target throughput without using this feature and steadily increased the target throughput across 10K, 50K, 100K, 200K, 500K, and 1 million producer messages per second, with four producers and four consumers using 1 KB messages. We then observed the maximum rate at which each system offers stable end-end performance for different configurations.
Throughput results
We found Kafka delivered the highest throughput of the systems we compared. Given its design, each byte produced was written just once onto disk on a code path that has been optimized for almost a decade by thousands of organizations across the world. We will delve into these results in more detail for each system below.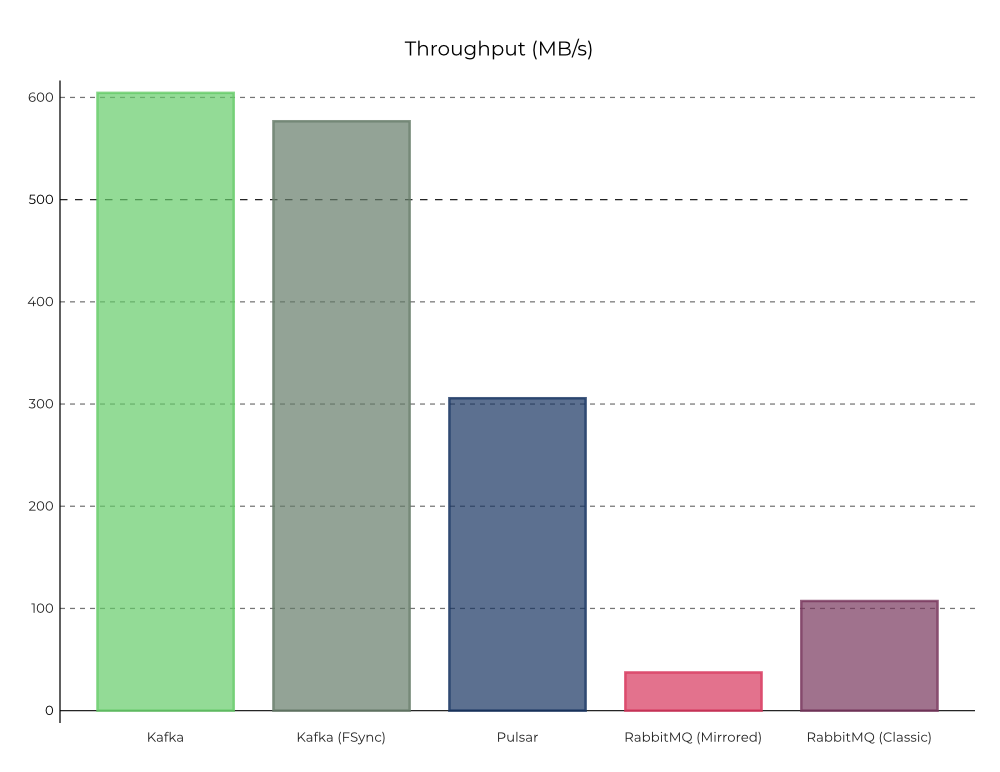 Figure 5. Comparison of peak stable throughput for all three systems: 100 topic partitions with 1 KB messages, using four producers and four consumers
We configured Kafka to use batch.size=1MB and linger.ms=10 for the producer to effectively batch writes sent to the brokers. In addition, we configured acks=all in the producer along with min.insync.replicas=2 to ensure every message was replicated to at least two brokers before acknowledging it back to the producer. We observed that Kafka was able to efficiently max out both the disks on each of the brokers—the ideal outcome for a storage system. See Kafka’s driver configuration for details.
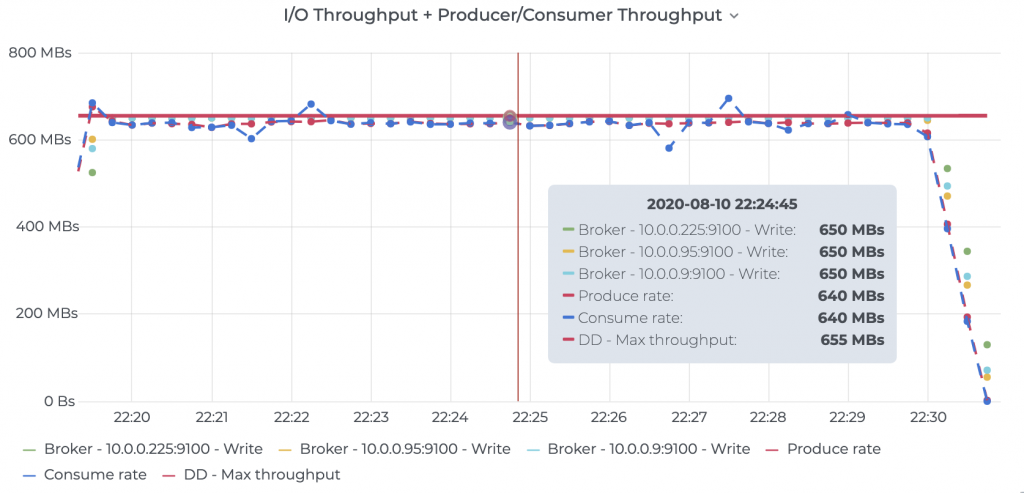 Figure 6. Kafka performance using the default, recommended fsync settings. The graph shows I/O utilization on Kafka brokers and the corresponding producer/consumer throughput (source: Prometheus node metrics). See raw results for details.
We also benchmarked Kafka with the alternative configuration of fsyncing every message to disk on all replicas using flush.messages=1 and flush.ms=0 before acknowledging the write. The results are shown in the following graph and are quite close to the default configuration.
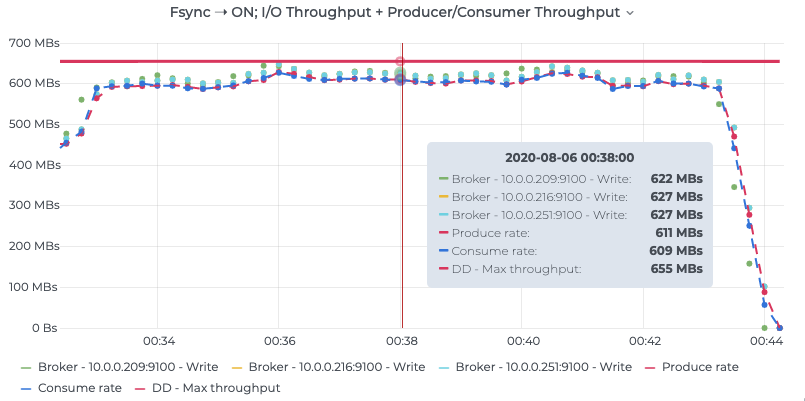 Figure 7. Prometheus node metrics showing I/O utilization on Kafka brokers and the corresponding producer/consumer throughput. See raw results for details.
Pulsar’s producer works differently from Kafka in terms of how it queues produce requests. Specifically, it has per-partition producer queues internally, as well as limits for these queue sizes that place an upper bound on the number of messages across all partitions from a given producer. To avoid the Pulsar producer from bottlenecking on the number of messages being sent out, we set both the per-partition and global limits to infinity, while matching with a 1 MB byte-based batching limit.
.batchingMaxBytes(1048576) // 1MB
.batchingMaxMessages(Integer.MAX_VALUE)
.maxPendingMessagesAcrossPartitions(Integer.MAX_VALUE);
We also gave Pulsar a higher time-based batching limit, batchingMaxPublishDelayMs=50, to ensure the batching kicks in primarily due to byte limits. We arrived at this value by continuously increasing the value to the point that it had no measurable effect on the peak stable throughput that Pulsar ultimately achieved. For the replication configuration, we used ensembleSize=3,writeQuorum=3,ackQuorum=2, which is equivalent to how Kafka was configured. See the Pulsar benchmark driver configs for details.
With BookKeeper’s design, where bookies write data locally into both a journal and a ledger, we noticed that the peak stable throughput was effectively half of what Kafka was able to achieve. We found that this fundamental design choice has a profound negative impact on throughput, which directly affects cost. Once the journal disk was fully saturated on the BookKeeper bookies, the producer rate of Pulsar was capped at that point.
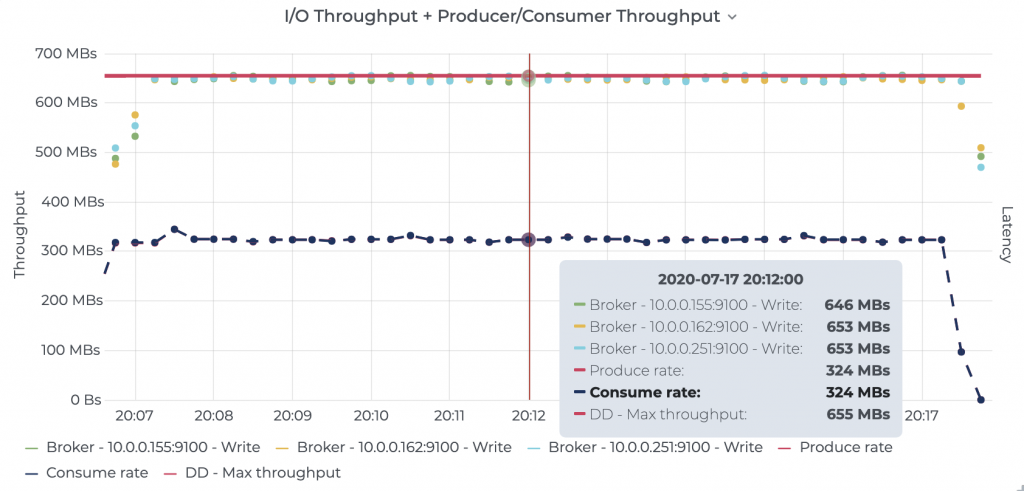 Figure 8. Prometheus node metrics showing BookKeeper journal disk maxed out for Pulsar and the resulting throughput measured at the BookKeeper bookies. See raw results for details.
To further validate this, we also configured BookKeeper to use both disks in a RAID 0 configuration, which provides BookKeeper the opportunity to stripe journal and ledger writes across both disks. We were able to observe that Pulsar maxed out the combined throughput of the disks (~650 MB/s) but was still limited to ~340 MB/s of peak stable throughput.
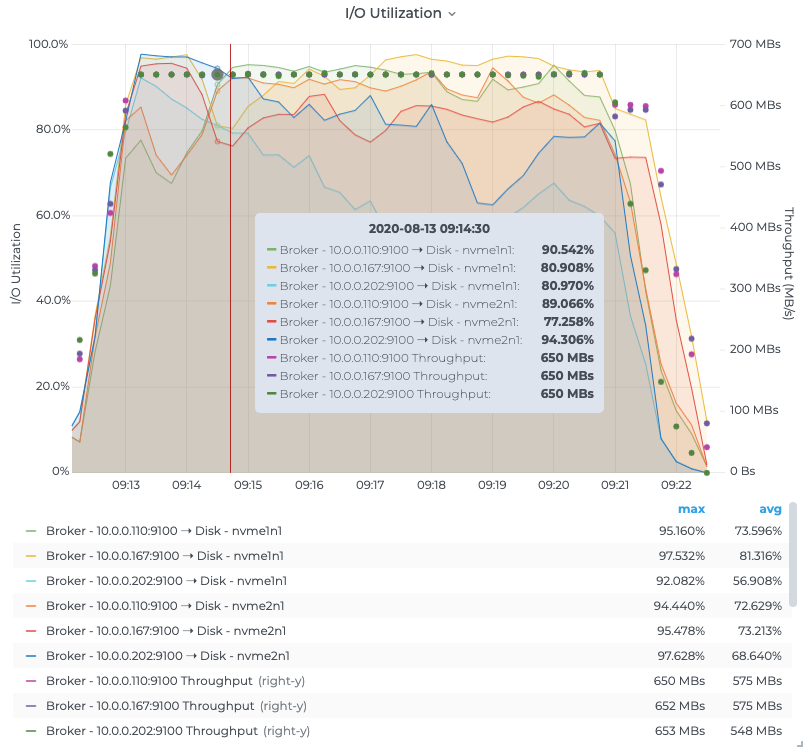 Figure 9. Prometheus node metrics showing BookKeeper journal disks still maxed out with a RAID 0 configuration
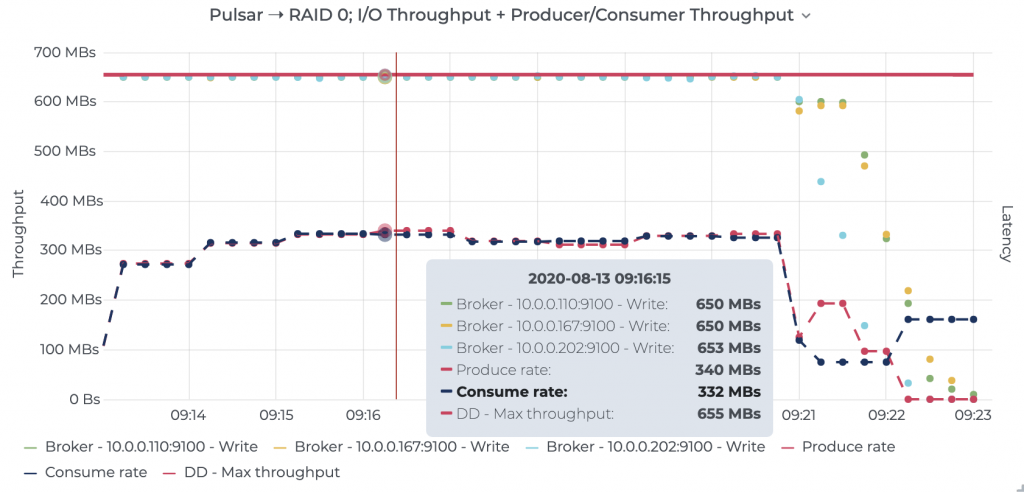 Figure 10. Prometheus node metrics showing RAID 0 disk getting maxed out and the resulting throughput measured at the Pulsar brokers. See raw results for details.
Pulsar has a tiered architecture that separates the BookKeeper bookies (storage) from the Pulsar brokers (caching/proxy for the storage). For completeness, we therefore also ran the throughput test above in a tiered deployment that moved the Pulsar brokers to three additional compute-optimized c5n.2xlarge (with 8 vCores, 21 GB RAM, Upto 25 Gbps network transfer, EBS-backed storage) instances. The BookKeeper nodes remained on the storage-optimized i3en.2xlarge instances. This resulted in a total of six instances/resources for Pulsar and BookKeeper in this special setup, with 2x extra CPU resources and 33% extra memory than what was given to Kafka and RabbitMQ.
Even at the high throughputs, the system is mostly I/O bound, and we did not find any improvements from this setup. See the table below for the full results of this specific run. In fact, without any real CPU bottlenecks, Pulsar’s two-tier architecture simply seems to just add more overhead—two JVMs taking up more memory, twice the network transfer, and more moving parts in the system architecture. We expect that when network constraints (unlike our tests which offered a surplus of network bandwidth), Pulsar’s two-tier architecture would exhaust the network resources twice as quickly and thereby reduce performance.
| Pulsar Deployment Model | Peak Produce Throughput (MB/s) |
| Tiered | 305.73 |
| Co-located | 305.69 |
RabbitMQ, unlike both Kafka and Pulsar, does not feature the concept of partitions in a topic. Instead, RabbitMQ uses an exchange to route messages to linked queues, using either header attributes (header exchanges), routing keys (direct and topic exchanges), or bindings (fanout exchanges), from which consumers can process messages. To match the setup for the workloads, we declared a single direct exchange (equivalent to a topic) and linked queues (equivalent to partitions), each dedicated to serving a specific routing key. End to end, we had all producers generating messages with all routing keys (round robin) and consumers dedicated to each queue. We also optimized RabbitMQ with best practices that were suggested by the community:
- Replication enabled (queues are replicated to all nodes in the cluster)
- Message persistence disabled (queues are in memory only)
- Consumer auto acking enabled
- Load-balanced queues across brokers
- 24 queues since RabbitMQ uses a dedicated core per queue (8 vCPUs x 3 brokers)
RabbitMQ did not fare well with the overhead of replication, which severely reduced the throughput of the system. We noticed all the nodes were CPU bound during this workload (cf. the green line with the right y-axis in the figure below), leaving very little room for any additional messages to be brokered. See the RabbitMQ driver configuration for details.
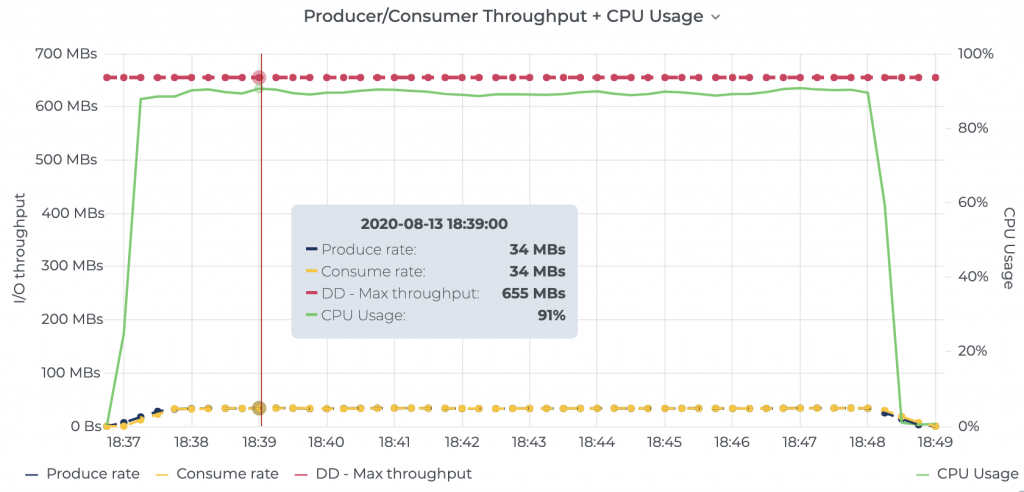 Figure 11. RabbitMQ throughput + CPU usage. See the raw results data for details.
Latency test
Given the ever-growing popularity of stream processing and event-driven architectures, another key aspect of messaging systems is end-to-end latency for a message to traverse the pipeline from the producer through the system to the consumer. We designed an experiment to compare this on all three systems at the highest stable throughput that each system could sustain without showing any signs of over-utilization.
To optimize for latency, we changed the producer configuration across all systems to batch messages up to a maximum of 1 ms only (versus the 10 ms we used for throughput tests), and to also leave each system at its default recommended configuration while ensuring high availability. Kafka was configured to use its default fsync settings (i.e., fsync off), and RabbitMQ was configured to not persist messages while still mirroring the queues. Based on repeated runs, we chose to compare Kafka and Pulsar at 200K messages/s or 200MB/s, which is below the single disk throughput limit of 300 MB/s on this testbed. We observed that, at throughputs higher than 30K messages/s, RabbitMQ would face CPU bottlenecks.
Latency results
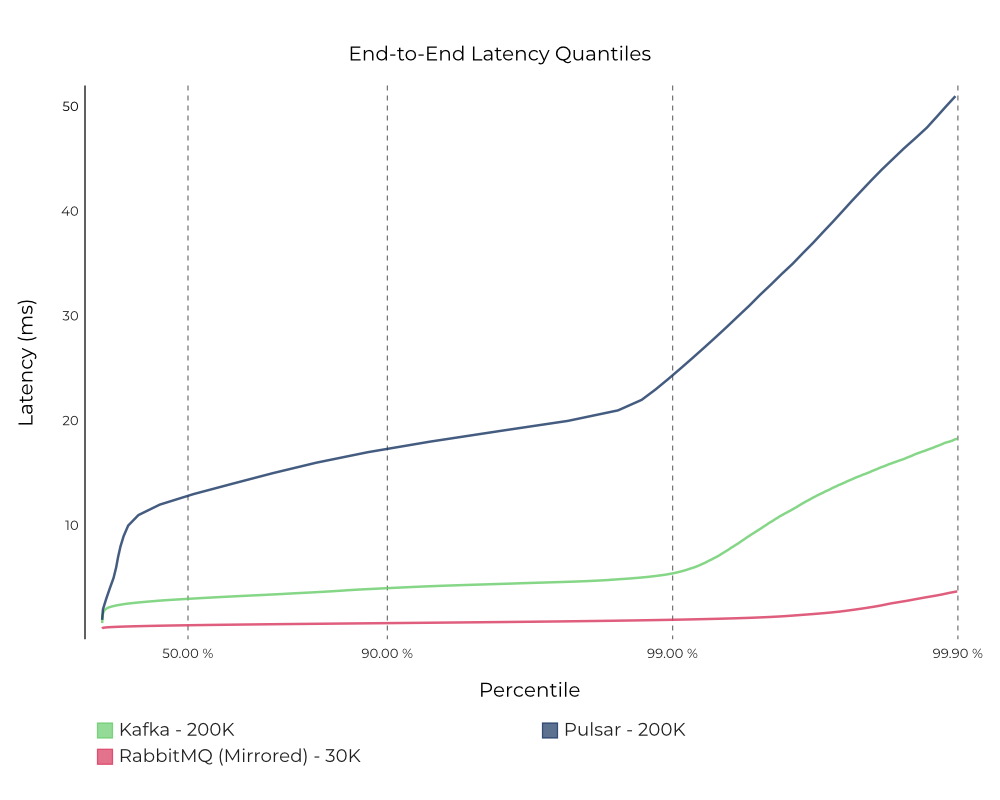 Figure 12. End-to-end latency for the standard modes configured for high availability measured at 200K messages/s (1 KB message size) on Kafka and Pulsar and at only 30K messages/s on RabbitMQ, because it couldn’t sustain a higher load. Note: Latency (ms)—lower is better.
Kafka consistently delivers lower latencies than Pulsar. RabbitMQ achieves the lowest latency among the three systems, but only at a much lower throughput given its limited vertical scalability. Since the experiment was deliberately set up so that, for each system, consumers were always able to keep up with the producers, almost all of the reads were served off of the cache/memory for all three systems.
Much of Kafka’s performance can be attributed to a heavily optimized read implementation for consumers, built on efficient data organization, without any additional overheads like data skipping. Kafka deeply leverages the Linux page cache and zero-copy mechanism to avoid copying data into user space. Typically many systems, like databases, have built out application-level caches that give them more flexibility to support random read/write workloads. However, for a messaging system, relying on the page cache is a great choice because typical workloads do sequential read/writes. The Linux kernel has been optimized for many years to be smart about detecting these patterns and employ techniques like readahead to vastly improve read performance. Similarly, building on top of the page cache allows Kafka to employ sendfile-based network transfers that avoid additional data copies. Staying consistent with the throughput test, we also ran the same test by configuring Kafka to fsync every message.
Pulsar takes a very different approach to caching than Kafka, and some of it stems from the core design choices in BookKeeper to separate the journal and ledger storage. Pulsar employs multiple layers of caching in addition to the Linux page cache, namely a readahead cache on BookKeeper bookies (retained the OMB default of dbStorage_readAheadCacheMaxSizeMb=1024 in our test), managed ledger (managedLedgerCacheSizeMB, 20% of available direct memory of 12 GB = 2.4 GB in our test). We did not observe any benefits to this multi-layer caching in our test. In fact, caching multiple times could increase the overall cost of deployment, and we suspect that there is a fair bit of padding in the 12 GB off-heap usage to avoid hitting Java GC issues with direct byte buffers as mentioned earlier.
RabbitMQ’s performance is a factor of both the exchanges at the producer side and the queues bound to these exchanges at the consumer side. We used the same mirroring setup from the throughput experiments for the latency experiments, specifically direct exchanges, and mirrored queues. Due to CPU bottlenecks, we were not able to drive a throughput higher than 38K messages/s, and any attempt to measure latency at this rate showed significant degradation in performance clocking a p99 latency of almost two seconds.
Gradually lowering the throughput down from 38K messages/s down to 30K messages/s allowed us to establish a stable throughput at which point the system did not appear to be over-utilized. This was confirmed by a significantly better p99 latency of 1 ms. We believe the overhead of replicating 24 queues across three nodes seems to have a profound negative impact on end-to-end latency at higher throughputs, while throughputs less than 30K messages/s or 30 MB/s (solid magenta line) allow RabbitMQ to deliver significantly lower end-to-end latencies than the other two systems.
In general, following its best practices allows RabbitMQ to provide bounded latencies. Given that the latency experiments were deliberately set up so that the consumers were always able to keep up with the producers, the efficiency of RabbitMQ’s messaging pipeline boils down to the number of context switches the Erlang BEAM VM (and thus the CPU) needs to do to process the queues. Thus, limiting this by dedicating a queue per CPU core delivers the lowest possible latency. In addition, using Direct or Topic exchanges allows for sophisticated routing (similar to consumers that are dedicated to a partition on Kafka and Pulsar) to specific queues. But direct exchanges offer better performance, owing to the absence of wildcard matching, which adds more overhead and was the suitable choice for this test.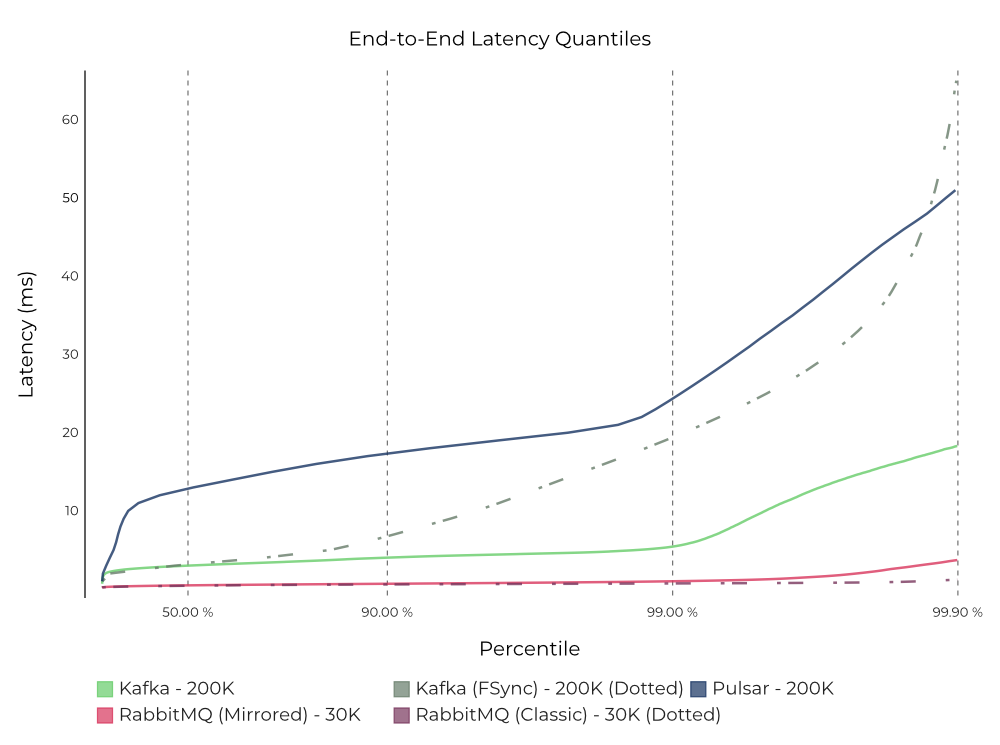 Figure 13. End-to-end latency for Kafka, Pulsar, and RabbitMQ, measured at 200K messages/s (1 KB message size) on Kafka and Pulsar, and 30K messages/s on RabbitMQ. See the raw results (Kafka, Pulsar, and RabbitMQ) for details. Note: Latency (ms)—lower is better.
We already covered the latency results of Kafka in its default, recommended fsync configuration (solid green line) at the beginning of this section. In the alternative configuration where Kafka fsync’s every message to disk (dotted green line), we found that Kafka still has lower latency than Pulsar almost up until the p99.9th percentile, while Pulsar (blue line) fared better on the higher-tail percentiles. While reasoning about tail latencies accurately at the p99.9th percentile and above is difficult, we believe that the non-linear latency shoots up at the p99.9th percentile for the alternative Kafka fsync configuration (dotted green line) could be attributed to corner cases involving the Kafka producer, given that the producer latencies seemed to follow the same trend.
Latency trade-offs
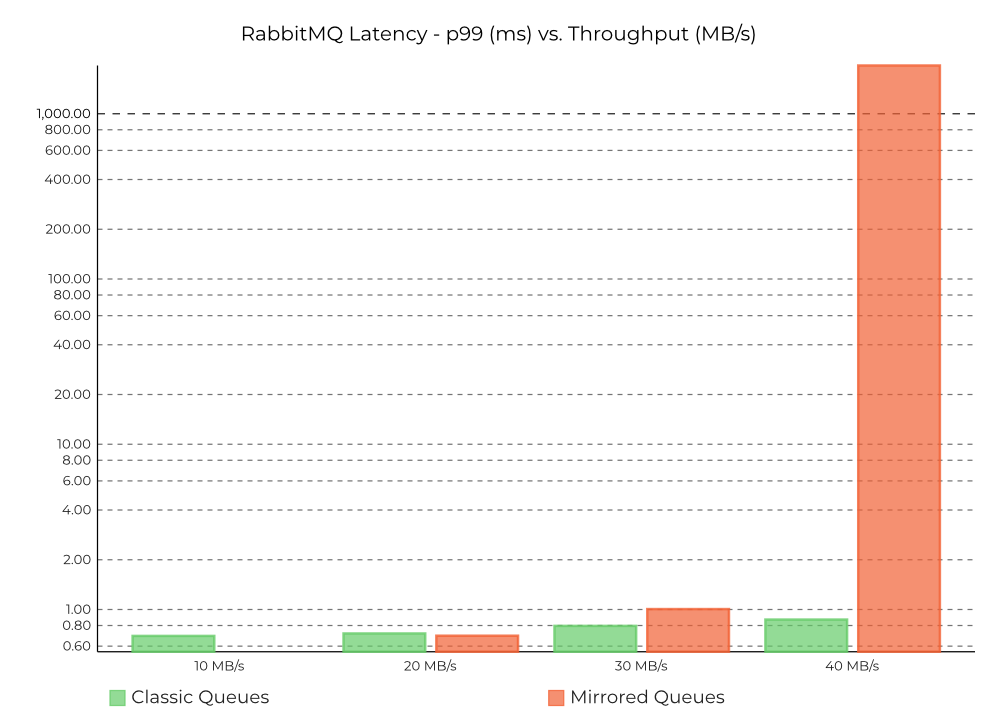 Figure 14. End-to-end latency for RabbitMQ: mirrored queues (configuration used in the tests) versus classic queues (no replication) at 10K, 20K, 30K and 40K messages/s. Note: The scale on the y-axis is logarithmic in this chart.
We acknowledge that every system is designed with certain trade-offs. Though unfair to Kafka and Pulsar, we found it interesting to compare RabbitMQ also in a configuration that does not deliver high availability versus Kafka and Pulsar, both of which trade lower latencies for providing stronger durability guarantees along with 3x more availability than RabbitMQ. This could be relevant to certain use cases (e.g., device location tracking), where it can be acceptable to trade off availability for better performance especially if the use case demands real-time messaging and is not sensitive to availability issues. Our results indicate that RabbitMQ can sustain lower latencies at higher throughputs better when replication is disabled, albeit even the improved throughput (100K messages/s) is still significantly lower than what Kafka and Pulsar can achieve.
Even though Kafka and Pulsar are slower (clocking ~5 ms and ~25 ms, respectively, at p99), the durability, higher throughput, and higher availability they provide are absolutely critical for large-scale event streaming use cases like processing financial transactions or retail inventory management. For use cases that demand lower latencies, RabbitMQ can achieve a p99 ~1 ms latency only as long as it’s lightly loaded since messages are just queued in memory with no overhead of replication.
In practice, the operator needs to carefully provision RabbitMQ to keep the rates low enough to sustain these low latencies barring which the latency degrades quickly and significantly. But this task is difficult and even practically impossible to achieve in a general fashion across all use cases. Overall, a better architectural choice with lower operational overhead and cost might be to pick a single durable system like Kafka for all use cases, where the system can provide the best throughput with low latencies across all load levels.
Summary
In this blog, we have presented a thorough, balanced analysis of three messaging systems: Kafka, RabbitMQ, and Pulsar, which leads to the following conclusions.
Throughput: Kafka provides the highest throughput of all systems, writing 15x faster than RabbitMQ and 2x faster than Pulsar.
Latency: Kafka provides the lowest latency at higher throughputs, while also providing strong durability and high availability. Kafka in its default configuration is faster than Pulsar in all latency benchmarks, and it is faster up to p99.9 when set to fsync on every message. RabbitMQ can achieve lower end-to-end latency than Kafka but only at significantly lower throughputs.
Cost/Complexity: Cost tends to be an inverse function of performance. Kafka as the system with the highest stable throughput, offers the best value (i.e., cost per byte written) of all the systems, due to its efficient design. In fact, Twitter’s Kafka journey of moving away from a BookKeeper-based architecture like Pulsar corroborates our observations that Kafka’s fewer moving parts lower its cost significantly (up to 75% in Twitter’s case). Additionally, the work on removing ZooKeeper from Apache Kafka (see KIP-500) is well underway and further simplifies Kafka’s architecture.
https://www.confluent.io/blog/kafka-fastest-messaging-system/
标签:messages,system,RabbitMQ,Kafka,throughput,Apache,Pulsar 来源: https://www.cnblogs.com/felixzh/p/14770792.html
