【大数据部落】R语言如何使用rjags R2jags来建立贝叶斯模型
作者:互联网
原文链接:https://www.cnblogs.com/tecdat/p/11121891.html
本文是通过对area,perimeter,campactness几个变量的贝叶斯建模,来查看他们对groovelength这个变量的影响.
并且对比rjagsR2jags和内置贝叶斯预测函数的结果。
读取数据
read data

seed=read.csv("seeds_dataset.csv")seed=seed[,1:7]

查看数据的结构str(seed)

'data.frame': 209 obs. of 7 variables: $ area : num 14.9 14.3 13.8 16.1 14.4 ... $ perimeter : num 14.6 14.1 13.9 15 14.2 ... $ campactness : num 0.881 0.905 0.895 0.903 0.895 ... $ length : num 5.55 5.29 5.32 5.66 5.39 ... $ width : num 3.33 3.34 3.38 3.56 3.31 ... $ asymmetry : num 1.02 2.7 2.26 1.35 2.46 ... $ groovelength: num 4.96 4.83 4.8 5.17 4.96 ...
建立回归模型
Do a linear model

lm(formula = groovelength ~ area + perimeter + campactness, data = seed) Residuals: Min 1Q Median 3Q Max -0.66375 -0.10094 0.00175 0.11081 0.45132 Coefficients: Estimate Std. Error t value Pr(>|t|) (Intercept) 19.46173 2.45031 7.943 1.29e-13 *** area 0.49724 0.08721 5.701 4.10e-08 *** perimeter -0.63162 0.18179 -3.474 0.000624 *** campactness -14.05218 1.34325 -10.461 < 2e-16 *** --- Signif. codes: 0 '***' 0.001 '**' 0.01 '*' 0.05 '.' 0.1 ' ' 1 Residual standard error: 0.1608 on 205 degrees of freedom Multiple R-squared: 0.895, Adjusted R-squared: 0.8934 F-statistic: 582.4 on 3 and 205 DF, p-value: < 2.2e-16
从回归模型的结果来看,三的自变量对因变量都有显著的意义。其中,area有正向的意义。而其他两个变量是负向的影响。从r方的结果来看,达到了0.895,模型具有较好的解释度。
使用arm软件建立贝叶斯回归模型
Bayesian analysis With bayesglm

bayesglm(formula = groovelength ~ area + perimeter + campactness, data = seed) Deviance Residuals: Min 1Q Median 3Q Max -0.66331 -0.09974 -0.00002 0.11110 0.44841 Coefficients: Estimate Std. Error t value Pr(>|t|) (Intercept) 18.90538 2.41549 7.827 2.63e-13 *** area 0.47826 0.08604 5.559 8.40e-08 *** perimeter -0.59252 0.17937 -3.303 0.00113 ** campactness -13.74353 1.32463 -10.375 < 2e-16 *** --- Signif. codes: 0 '***' 0.001 '**' 0.01 '*' 0.05 '.' 0.1 ' ' 1 (Dispersion parameter for gaussian family taken to be 0.02584982) Null deviance: 50.4491 on 208 degrees of freedom Residual deviance: 5.2992 on 205 degrees of freedom AIC: -164.91 Number of Fisher Scoring iterations: 6
从内置贝叶斯模型的结果来看,3个变量同样是非常显著,因此模型的结果和回归模型类似。然后我们使用BUGS/JAGS软件包来建立贝叶斯模型
使用 BUGS/JAGS软件包来建立贝叶斯模型library(R2jags)
library(coda)

建立贝叶斯模型

jags(model.file='bayes.bug',parameters=c("area","perimeter","campactness","int"),data =list('a' =seed$area, 'b' =seed$perimeter, 'c' =seed$campactness, 'N'=N, 'y'=groovelength),n.chains =4,inits=NULL)
查看模型结果:
module glm loaded

Compiling model graph Resolving undeclared variables Allocating nodes Graph information: Observed stochastic nodes: 209 Unobserved stochastic nodes: 5 Total graph size: 1608

Initializing model

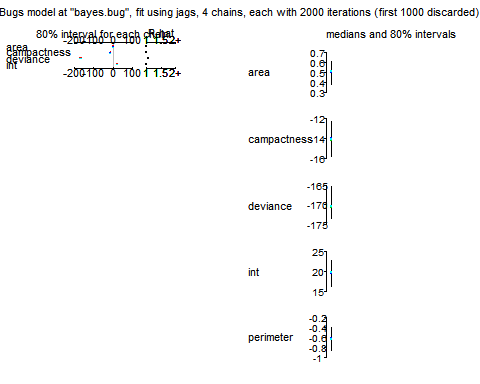
library('R2jags')bb <-jags1$BUGSoutput extract the "BUGS output" componentmm <-as.mcmc.bugs(bb) convert it to an "mcmc" object that coda can handleplot(jags1) large-format graph

从上面的图中,我们可以看到哥哥自变量的中位数和置信区间。从置信区间来看,各个变量的取值和内置贝叶斯模型的结果类似。内置贝叶斯结果的值全部落入在了置信区间内。
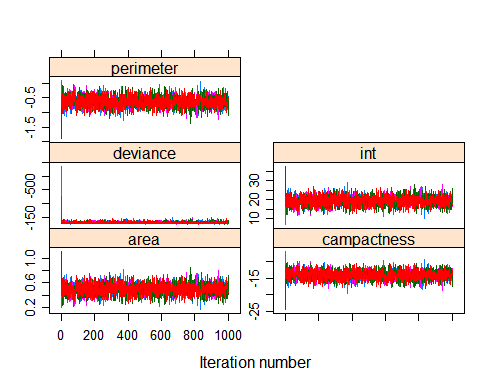
然后绘制每次迭代中各个变量参数的轨迹图
trace + density plots, same as above prettier trace plot

可以看到每个变量的参数都在一定区间内波动。同时可以看到误差在一定的迭代次数之后趋于收敛。
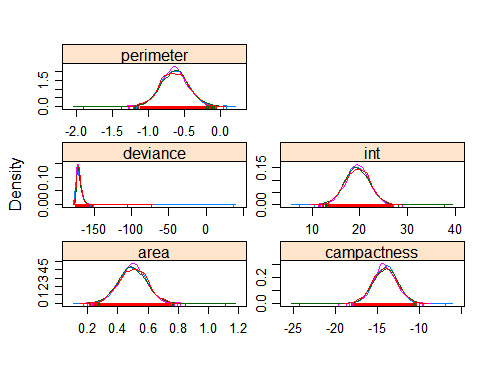
然后绘制每个变量参数的密度图
prettier density plot

可以看到每个变量的参数,的密度分布近似于正态分布。同时我们可以看到分布的均值和内置贝叶斯模型,得到的结果类似。
然后绘制每个变量参数的置信区间
estimate + credible interval plot

从结果来看,可以看到各个变量参数的置信区间,campatness和int的置信区间较大,而其他两个变量的置信区间较小。
从上面的实验结果对比,我们可以看到,三个自变量对因变量均有重要的影响。area,perimeter,campactness几个变量他们对groovelength这个变量均有重要的影响.同时我们可以认为回归模型的结果和内置贝叶斯模型的结果相似。然后我们使用rjags&R2jags软件包来对数据进行贝叶斯型的建立,从结果来看,同样和之前得到的模型结果相差不大。并且我们通过模型的迭代,可以得到每个参数的置信区间。
标签:perimeter,area,模型,campactness,贝叶斯,seed,R2jags,rjags 来源: https://blog.csdn.net/qq_19600291/article/details/73648163
